June 24, 2026
You know the feeling. The conference went well, sponsors were happy, members stayed engaged, and your team can point to packed sessions, strong hallway conversations, and a burst of post-event activity. Then the board asks the hard question: which of those efforts drove revenue?
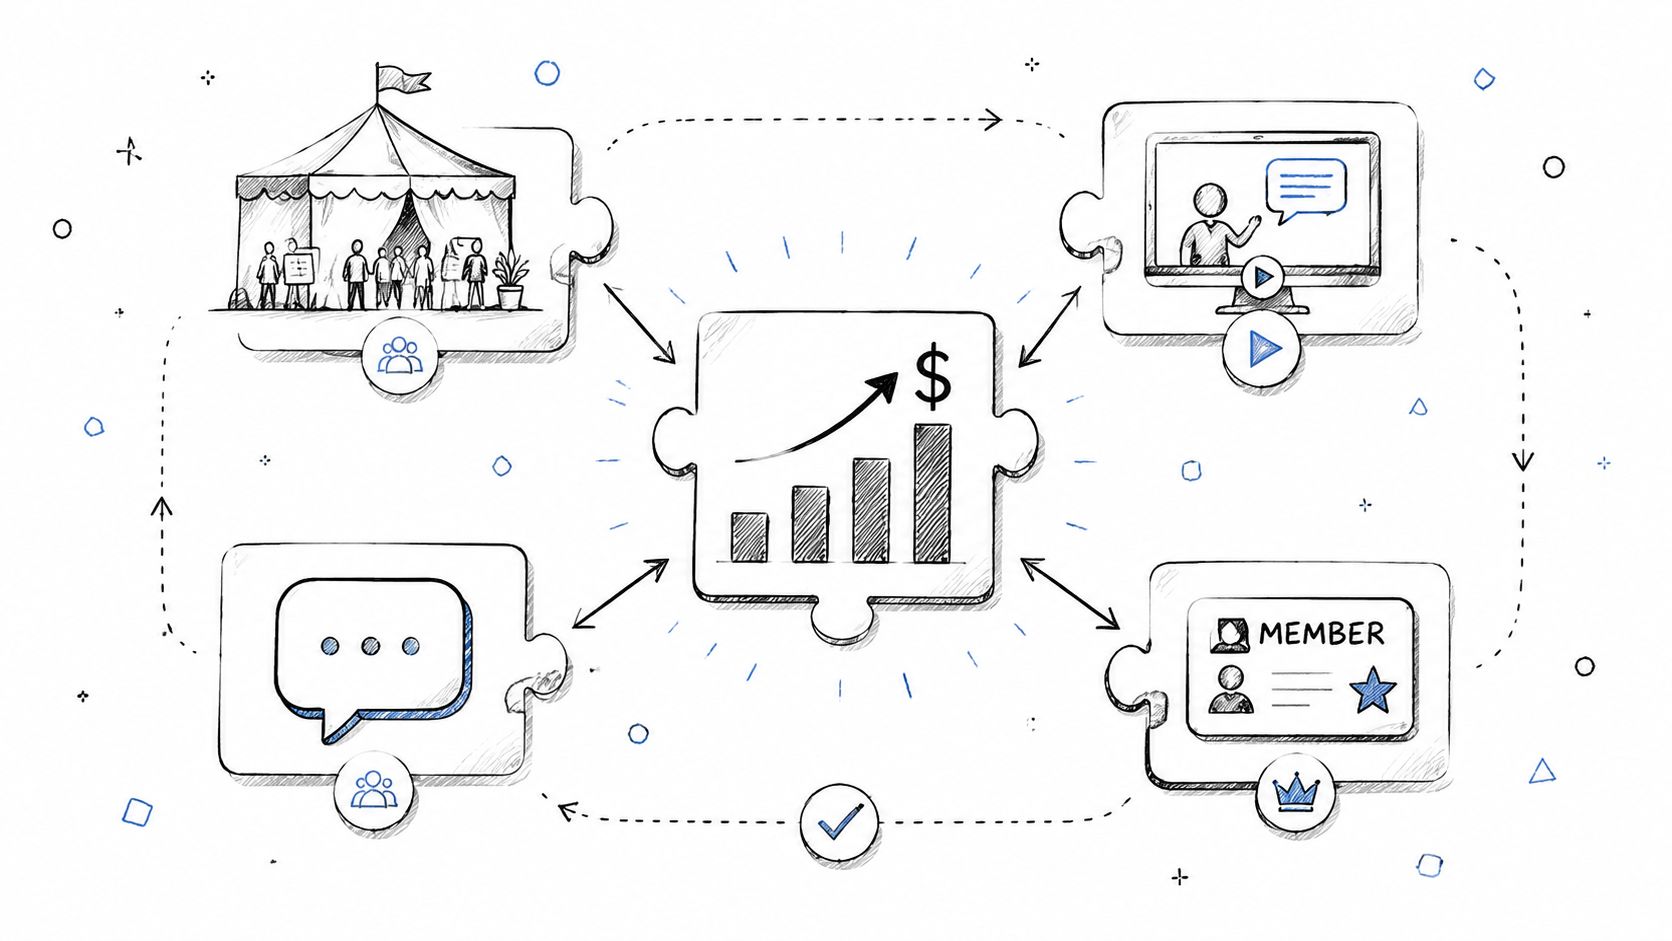
That's where most professional associations get stuck. The most valuable moments often happen in places that standard dashboards barely recognize. A QR code check-in, a sponsor conversation at a booth, a VIP registration completed through a custom form, a member who joins a discussion after the event and upgrades later. Everyone involved can see the connection. Very few teams can prove it cleanly.
Revenue attribution fixes that gap when it's built around how associations and event-led communities operate. Not just ads and web clicks. Not just a last-click report from an analytics tool. Its primary role is connecting community activity, event participation, and membership behavior to actual dollars in a way leadership can trust.
Many teams don't lose budget because their work lacks value. They lose budget because they can't show which activities created revenue and which ones generated activity alone.
That distinction matters more each year. The marketing analytics and attribution technology market is projected to surpass $8.5 billion by 2028, and companies using advanced attribution achieve 15% to 25% higher marketing efficiency. On the other side, companies without proper attribution commonly waste 25% to 30% of their total marketing budget on underperforming channels, according to marketing attribution market data and Forrester-backed findings.
For professional associations, the problem is sharper than it is for a simple ecommerce brand. Your team isn't just managing one conversion path. You're running memberships, renewals, event registrations, sponsor packages, premium content, and community touchpoints that can influence revenue over a long period.
A board member may believe your annual conference matters. A finance lead may agree that community engagement supports retention. But when budgets tighten, belief gets replaced by comparison.
If paid media has visible reports and your event program has stories, paid media tends to win. Not because it performs better. Because it's easier to defend.
Practical rule: If a revenue-driving program can't be measured, someone will eventually label it discretionary.
Good revenue attribution does more than justify budget. It changes operating behavior:
A strong attribution practice also helps careers. The people who can connect community and event activity to revenue tend to get more influence, because they're no longer reporting effort. They're reporting business impact.
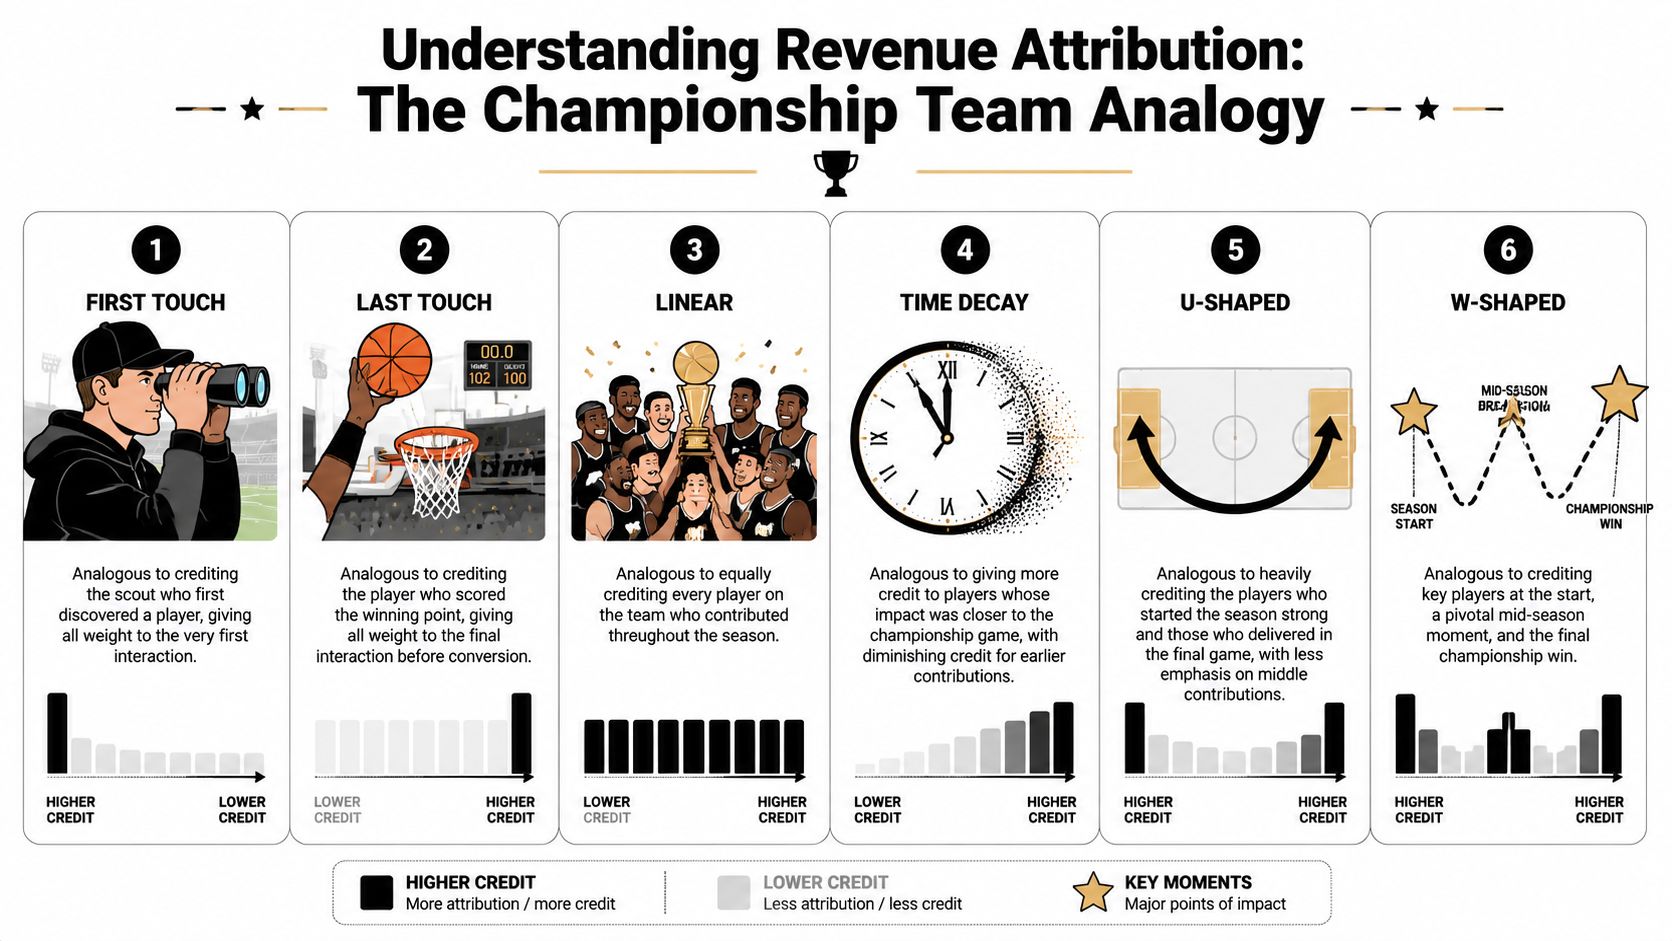
A simple way to think about revenue attribution is sports. One player may score the winning goal, but the goal only happened because other players moved the ball up the field. If you give full credit to just one moment, you miss how the play unfolded.
That's what attribution models do. They decide how much credit each touchpoint gets for a conversion.
In B2B environments, single-touch attribution models underestimate marketing ROI by 30–45% compared to data-driven multi-touch models, because they ignore the 4–7 touchpoints that typically happen before conversion, according to Attribution App's revenue attribution overview.
| Model | How it Works | Pros | Cons |
|---|---|---|---|
| First-Touch | Gives all credit to the first known interaction | Useful for understanding what creates initial awareness | Ignores everything that persuaded the buyer later |
| Last-Touch | Gives all credit to the final interaction before conversion | Easy to set up and explain | Overstates closing actions and undervalues nurturing |
| Linear | Splits credit evenly across all recorded touchpoints | Simple multi-touch starting point | Treats every touchpoint as equally important |
| Time-Decay | Gives more credit to touchpoints closer to conversion | Helpful when later-stage actions carry more weight | Can under-credit early awareness and education |
| U-Shaped | Heavily credits the first and last major touchpoints, with the rest distributed in between | Balances discovery and conversion | Can flatten important middle-stage actions |
| W-Shaped | Emphasizes first touch, a key middle milestone, and final conversion | Better for complex B2B journeys with meaningful stage changes | Harder to maintain if your milestones aren't consistently tracked |
First-touch and last-touch are rarely enough on their own for associations. They're too blunt.
A member might first encounter your organization through a LinkedIn post, attend a webinar weeks later, meet your team at a conference, join a community discussion, and only then purchase a membership or sponsor package. If you assign all revenue to the first or last step, you distort reality.
For that reason, most community and event-driven teams do better by starting with a practical multi-touch model, usually linear, time-decay, or U-shaped. If you want a good companion read on how channels interact across longer journeys, Keywordme's attribution guide offers a useful framework.
The best model isn't the most advanced one. It's the one your team can explain, maintain, and use to make decisions.
A lot of teams keep using last-click because it's what their reporting tool defaults to. That's convenience, not strategy.
For associations, the right question is usually this: which model best reflects how someone becomes a paying member, sponsor, exhibitor, or event buyer in your world? If your answer includes repeated engagement, human follow-up, and offline contact, you already know single-touch won't capture enough of the story.
Standard attribution guidance assumes a mostly digital journey. Someone clicks an ad, visits a page, fills out a form, and converts. That model breaks as soon as a professional association runs the kinds of experiences that influence trust.
A lot of your highest-value interactions happen off the website. They happen in workshops, at roundtables, in sponsor lounges, at chapter events, and during private follow-up conversations. Traditional reporting often treats those moments as if they never happened.
This is why event and community teams often feel unfairly measured. They're being asked to prove value using systems built for digital ad channels.
Data indicates that 60-70% of B2B deal influence occurs offline, yet many systems treat those interactions like black holes instead of connecting them to eventual revenue, according to NetSuite's discussion of revenue attribution gaps.
When that happens, common reports end up over-crediting whatever digital action came last:
That's not just a data problem. It changes funding decisions.
There's another blind spot that hurts association teams. A lot of community and content activity has little or no direct ad spend, so it can appear almost free in reports even when it takes serious labor.
Moderation, speaker coordination, content production, member support, and follow-up workflows all cost time and money. If those costs aren't captured, paid channels can look more efficient than they really are, while community-led revenue gets undervalued. That's one reason many teams struggle to explain why engagement programs deserve protection during planning cycles.
A more honest approach looks beyond ad spend and asks what it costs to produce a revenue-influencing touchpoint.
If your model counts media spend but ignores staff time tied to community and event delivery, your ROI picture is incomplete.
For teams trying to tighten that connection between event effort and business outcome, this guide to measuring event ROI is a useful complement to attribution work.
Associations don't need a different definition of revenue attribution. They need a broader data model.
The member journey still has stages. Awareness, consideration, conversion, renewal, expansion. But the signals inside those stages are different. Event attendance, sponsor engagement, content consumption, and member participation often matter as much as pageviews and form fills. If your attribution setup can't absorb those signals, it will keep undervaluing the programs that create trust over time.
Vanity metrics don't help much when leadership asks where revenue came from. Open rates, likes, and raw attendee counts can be useful diagnostics, but they don't answer the budget question.
The KPIs below do. They connect community and event activity to money, retention, and channel quality.
Event-sourced revenue tracks revenue from people whose journey began with or was materially influenced by an event. That can include memberships, sponsorships, upgrades, course purchases, or renewals that followed attendance. The point isn't to force every dollar into a single event bucket. The point is to see whether events produce revenue-generating relationships.
Marketing-sourced membership revenue focuses on members acquired through identifiable campaigns or touchpoints. This is especially useful when comparing event-led, content-led, partner-led, and paid acquisition paths.
Renewal-influenced revenue matters because associations don't just sell once. If participation in webinars, communities, or chapter events consistently shows up before renewals, that signal belongs in revenue reporting.
A second group of KPIs helps you judge efficiency, not just output:
A KPI only helps if your team uses it to make decisions.
For example, webinar attendance by itself isn't a revenue metric. But if attendees later renew at a higher rate, or if they convert into paid memberships more reliably than newsletter subscribers, the webinar becomes part of a revenue path worth protecting.
The same applies to churn and retention. Membership organizations often find that engagement signals explain future revenue quality better than acquisition volume does. That's why churn analysis should sit next to attribution reporting, not apart from it. This churn analysis guide is worth reviewing when you're defining your KPI set.
Decision lens: A channel that brings fewer people but better members can be more valuable than a channel that floods the funnel with low-intent leads.
A workable monthly scorecard usually includes:
| KPI | Why it matters |
|---|---|
| Event-sourced revenue | Shows whether events contribute to actual dollars, not just attendance |
| Membership conversion by channel | Reveals which acquisition paths create paying members |
| Renewal-influenced revenue | Connects engagement programs to retention |
| Cost per acquisition by channel | Exposes where efficiency is strong or weak |
| Engagement-to-conversion rate | Helps separate passive participation from meaningful intent |
That mix gives leadership a cleaner view of which programs create revenue now and which ones protect future revenue.
Most attribution projects fail for one simple reason. Teams start with reporting before they've fixed data flow.
A practical setup starts smaller than people expect. Technical implementation requires at least three integrated data layers: website analytics, a CRM, and a billing platform. It also matters that the data is clean, because a simple attribution model with deduplicated records outperforms a more advanced model built on fragmented systems, according to the implementation guidance discussed earlier.
Here's the roadmap most association teams should follow first.
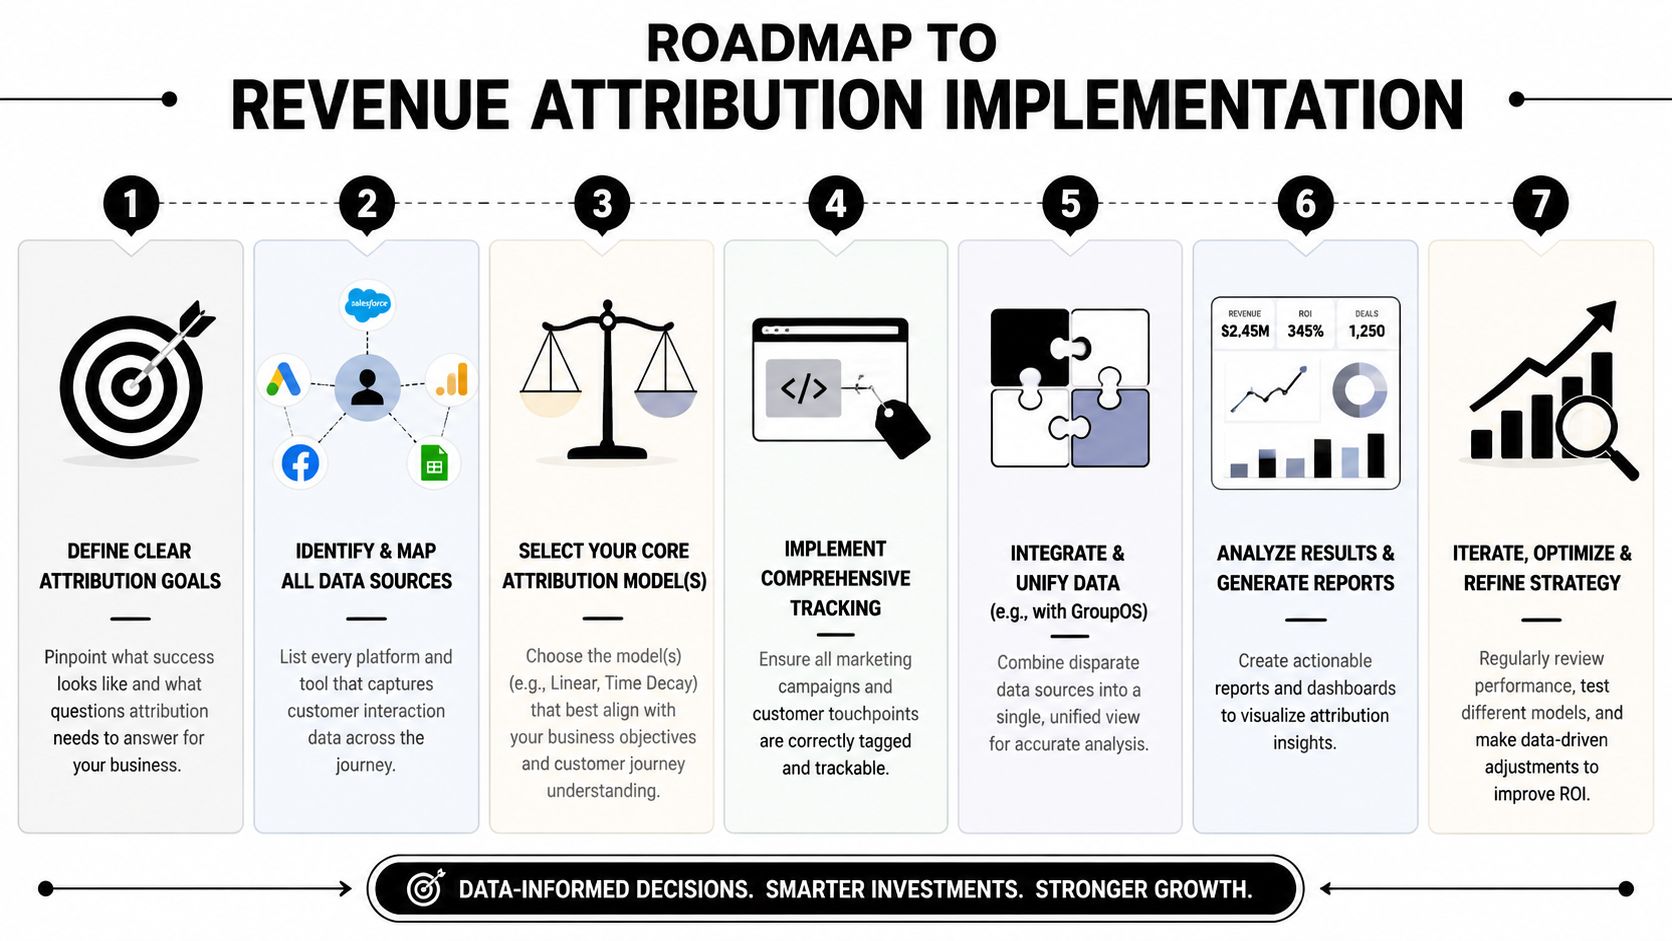
Don't begin with every possible click. Begin with revenue-adjacent milestones.
For an association, that usually includes:
If your team can't agree on which events count as real milestones, reporting will stay muddy.
You need consistent naming, enforced UTM rules, and a clear owner for campaign setup. Offline activities need the same discipline. That means QR destinations, custom forms, sponsor assets, and event-specific landing pages should all map back to agreed naming conventions.
Messy data usually shows up in familiar ways:
For teams dealing with fractured systems, this breakdown of data integration challenges is a practical place to start.
A short walkthrough can help make the implementation sequence concrete.
A lot of teams jump too quickly to algorithmic attribution. In practice, a well-maintained linear or U-shaped model is often more useful than an advanced setup nobody trusts.
Make sure your stack answers these basics first:
Clean identity resolution beats model sophistication almost every time.
Once that foundation is in place, you can test additional models. But until the systems talk to each other reliably, model debates are mostly noise.
The hardest attribution problem for associations isn't digital marketing. It's stitching together the in-person moments and community signals that most software drops.
That's where a unified operational platform changes the job. Instead of trying to patch event attendance, custom forms, membership actions, content engagement, and sponsor interactions together after the fact, the system records them inside one member and event environment.

Take a common association scenario.
A prospect attends an annual conference and checks in on-site through a QR workflow. During the event, they visit a sponsor page, complete a custom form for a VIP session, and later join a member discussion tied to the conference topic. After the event, they download gated content, return for an on-demand session, and purchase a premium membership.
In many stacks, those touchpoints live in separate tools:
That fragmentation is exactly why so many offline signals disappear from revenue reporting.
When the system holds registrations, QR check-ins, membership actions, content engagement, messaging activity, and billing-linked behavior under the same operating umbrella, attribution becomes much more believable.
That matters because, as noted earlier, 60-70% of B2B deal influence occurs offline, yet most software still struggles to connect things like QR code check-ins or custom form data to user-level revenue. A platform built around first-party interaction capture helps close that gap rather than exporting it to manual spreadsheet work.
For teams thinking seriously about that data foundation, this first-party data collection perspective is directly relevant.
Associations don't usually have a tracking problem. They have a stitching problem.
The payoff isn't just cleaner dashboards.
It means your team can answer harder questions with confidence:
| Question | Signal path you need |
|---|---|
| Did the conference generate premium memberships? | Registration, attendance, follow-up engagement, membership purchase |
| Which sponsor activations influenced pipeline? | Sponsor profile views, custom form submissions, meeting activity, later conversion |
| Which members are most likely to renew? | Community participation, content consumption, event attendance, billing history |
| Which event formats create valuable accounts? | Ticket type, engagement pattern, post-event behavior, revenue outcome |
That's a significant improvement. You move from isolated touchpoints to a continuous revenue narrative.
Collecting attribution data is only half the job. Leadership needs a report they can use.
The most effective reporting workflow turns raw interaction data into a small number of decisions. Which channels deserve more budget? Which event formats create better members? Which sponsor packages produce revenue, not just lead volume?
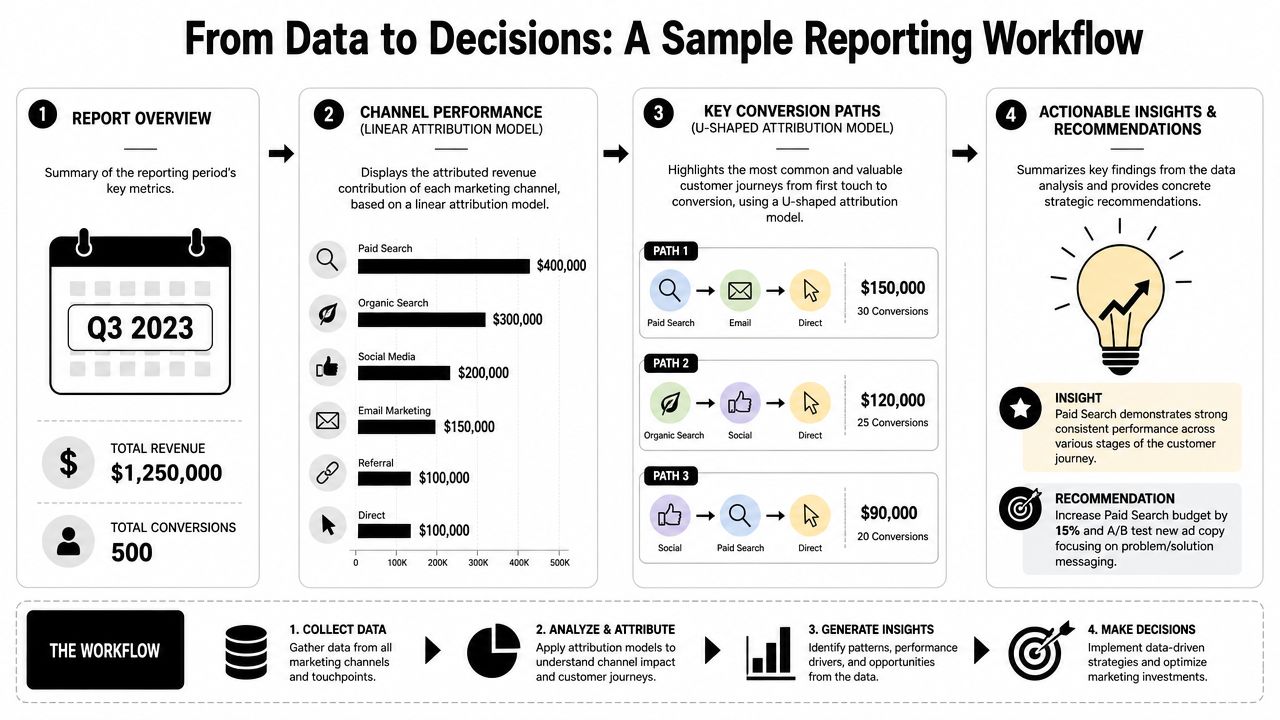
A usable workflow often looks like this:
A strong report usually includes:
One thing matters here more than perfect precision. Consistency. If leadership sees the same model, the same definitions, and the same business questions every period, trust builds fast.
A good attribution report doesn't just explain the past. It tells the team what to do next.
If your association is tired of treating conferences, memberships, sponsor activity, and community engagement as separate systems, GroupOS is worth a close look. It brings events, memberships, content, communication, and first-party data together in one environment, which makes revenue attribution far more practical for organizations whose most valuable interactions don't happen in a neat digital funnel.