January 25, 2026
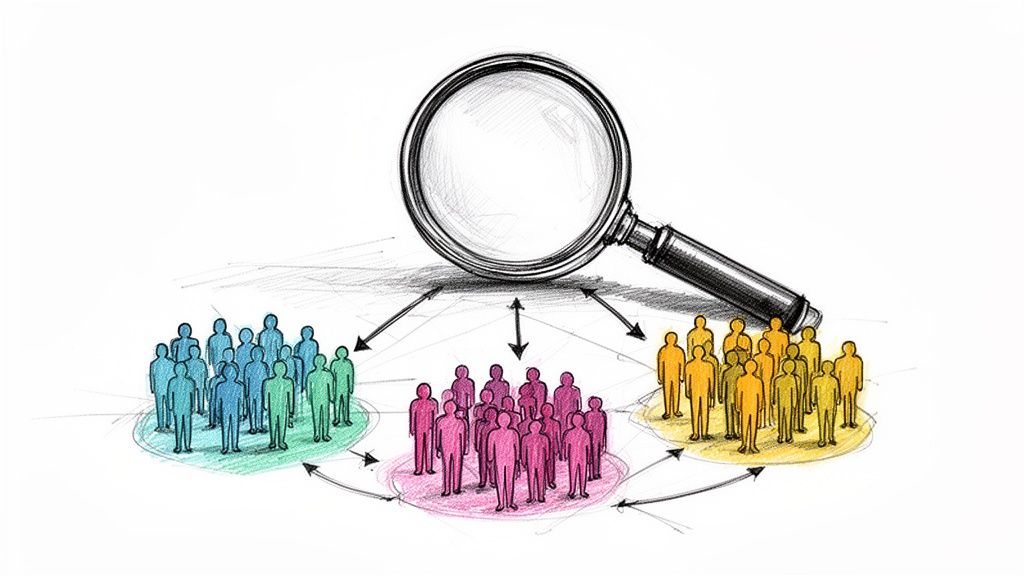
Customer segmentation models are really just frameworks for dividing your broad audience into smaller, more manageable groups based on what they have in common. This simple act is what lets you stop shouting into the void with one-size-fits-all marketing and start having relevant conversations that actually connect with people.
Think of a librarian trying to help people by yelling out random book recommendations in a crowded room. A few might perk up, but most of it is just noise. Now, imagine that same librarian organizing the library by genre—fiction, history, science. Suddenly, every reader can easily find exactly what they’re looking for.
That’s customer segmentation in a nutshell. It’s how you bring order to your audience so you can have meaningful, one-on-one conversations, but at scale.
For associations and event organizers, this isn’t just a nice-to-have tactic; it's the foundation for real growth. It’s about knowing your members and attendees on a much deeper level than just their name or job title. When you get this right, you can tailor every single interaction—from event invites to content suggestions—making sure each message feels personal and valuable.
The idea of targeting specific groups isn't exactly new, but the way we do it has changed dramatically. The concept really got its start back in the mid-20th century. A guy named Wendell R. Smith published a landmark paper in 1956 called "Product Differentiation and Market Segmentation as Alternative Marketing Strategies," which kicked off the shift away from mass marketing. Back then, it was all about basic demographics like age, income, and location.
Fast forward to today, and we have access to so much more data, which powers far more sophisticated and effective customer segmentation models. This evolution is what allows us to build genuine connections, not just sort people into broad buckets.
Putting a good segmentation strategy in place has a direct impact on your bottom line. Once you understand the distinct needs and behaviors of your different audience groups, you can stop wasting time and money on outreach that falls flat. Instead, you can focus your energy where it will make a real difference. The benefits of community engagement are multiplied when you can speak to specific segments in a way that truly resonates.
Here's a quick look at the strategic impact of getting segmentation right.
Ultimately, this strategic clarity helps you work smarter, not harder.
You can achieve some incredible results by zeroing in on what different groups need:
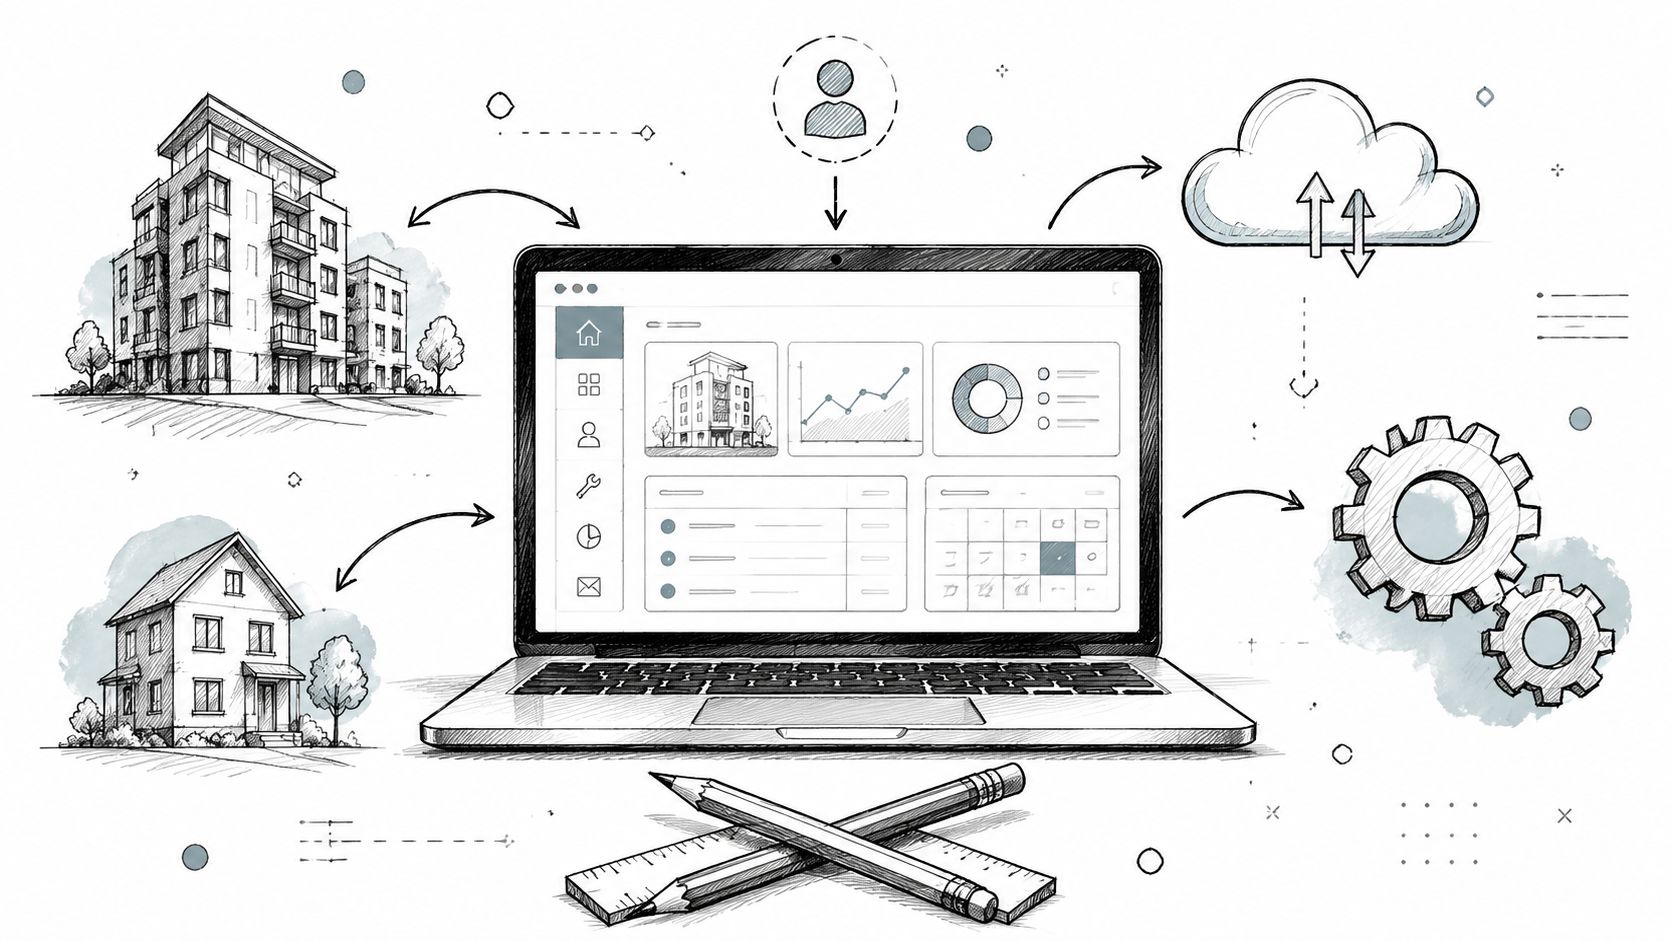
Think of customer segmentation models as different lenses for looking at your audience. Each one brings a unique part of the picture into focus, helping you understand not just who your members are, but why they act the way they do. It’s like having a set of blueprints for your community; one shows the basic structure, while others reveal the intricate wiring and plumbing, giving you the complete view you need to build something truly great.
Getting a handle on these foundational models is the first step toward crafting a strategy that genuinely connects with people. Let’s break down the most important types.
As this infographic shows, the benefits of getting this right—like personalized communication and a real boost in engagement—are what ultimately lead to sustainable growth.
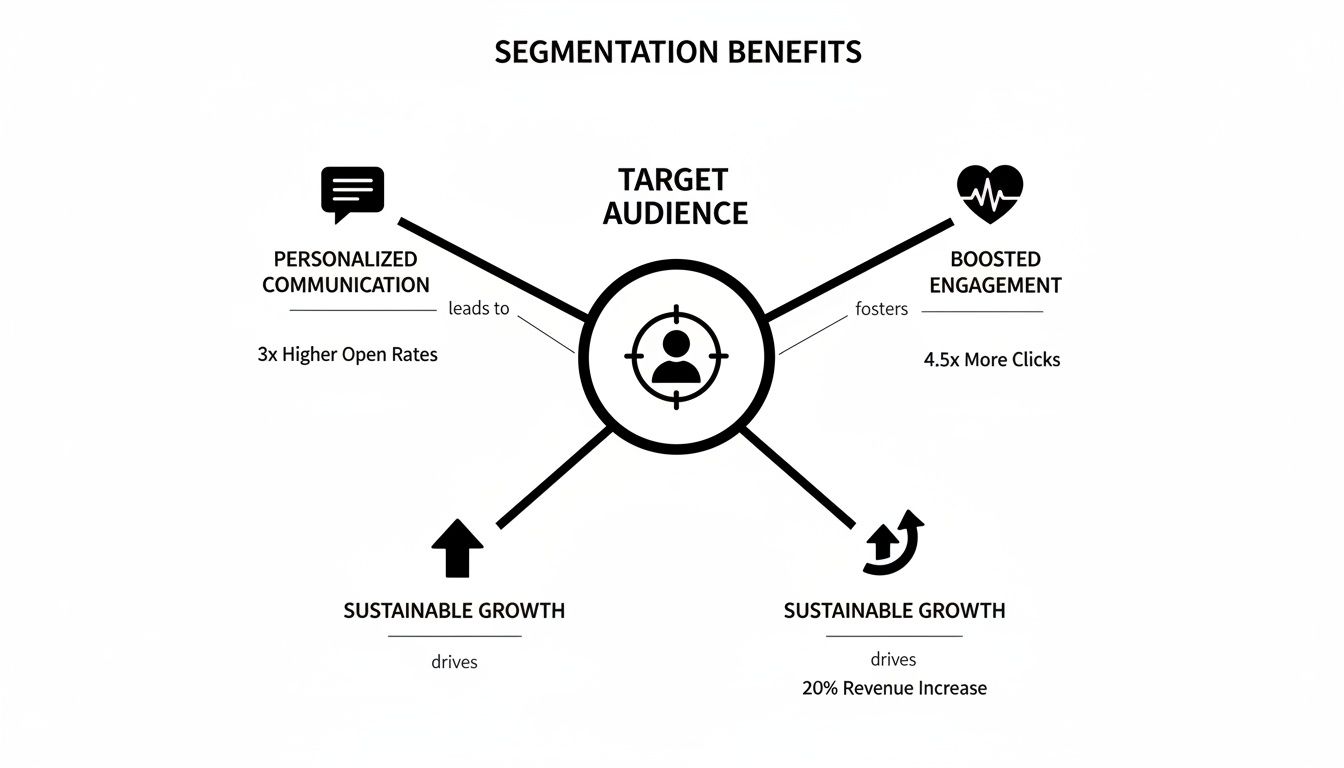
When you nail these three areas, you create a powerful feedback loop. Better communication drives higher engagement, and that engagement is what fuels your long-term success.
To help you choose the right approach, let's look at the most common models side-by-side.
This table gives a quick overview of the primary models, highlighting what they focus on, the kind of data you'll need, and where they shine for associations and event planners.
Each model offers a distinct advantage. While a simple model like demographic segmentation is great for a quick start, combining it with behavioral or psychographic data is where the real magic happens, allowing you to create truly nuanced and effective campaigns.
Now, let's dig a little deeper into each of these.
This is the classic, the one everyone starts with. Demographic segmentation groups people based on objective, statistical facts. It’s your baseline for understanding the "who."
These data points are usually the easiest to get your hands on and give you a solid, high-level snapshot of your audience.
For an association, this data is pure gold. You can use it to aim a career development webinar squarely at members under 30, or promote a family-friendly conference track to members who are married with kids. It’s straightforward but effective.
Next up is geographic segmentation, which sorts your audience based on their physical location. This is absolutely critical for any organization with a local or regional footprint, as it lets you tailor outreach to specific areas.
Don’t just think country or state. You can get as granular as a city, a specific neighborhood, or even a climate zone. For event managers, this isn't just nice to have—it's essential. You can quickly find members in a specific city to promote a local meetup or tweak your event marketing based on regional travel times and local interests.
While demographics tell you who people are, psychographics get to the heart of why they do what they do. This is where you move beyond the surface-level facts and start exploring the more intangible traits of your audience.
Psychographic segmentation focuses on a person's internal world. It groups people by their shared values, attitudes, interests, and lifestyle choices, revealing the deep-seated motivations that drive their decisions.
This is how you build real, lasting connections. For instance, an association might discover a segment of members who value networking above all else. With that insight, you can promote conference happy hours and highlight the interactive chat features in your event app directly to this group. Your message lands perfectly because it speaks to what they truly care about.
The digital boom of the early 2000s put this kind of analysis on the map. Statistician Andrew Pole’s work at Target is a legendary example; he built a model that could identify pregnant customers with 87% accuracy just from their shopping habits. This kicked off an era where understanding lifestyles and values became standard practice.
For GroupOS users, this means you can segment members by their core motivations. You can separate the 'networkers' who live for interactive maps and attendee chats from the 'learners' who binge-watch on-demand content, then give each group exactly what they want.
Here's where things get really interesting. Behavioral segmentation groups people based on their direct actions and interactions with your organization. This is arguably one of the most powerful customer segmentation models because it’s based on what people actually do, not on assumptions about who they are.
The data points here are all about action:
Imagine you spot a group of members who have watched several on-demand sessions from last year's conference. You can create a targeted campaign giving them early-bird access to this year's video library, knowing it’s an offer that speaks directly to their proven interests. If you want to go even deeper, exploring things like multi-touch attribution models can show you exactly which touchpoints led to these behaviors.
Finally, there’s firmographic segmentation. Think of it as demographics, but for businesses. If your association relies on corporate memberships or your events attract company-sponsored attendees, this model is a must.
It groups organizations based on attributes like:
If basic segmentation models give you a good snapshot of your audience, think of advanced models as the high-resolution, panoramic view. They let you zoom in on the subtle details and hidden patterns that tell you not just what your members have done, but what they're likely to do next.
For anyone running an association or managing events, this is where the real magic happens. It’s the difference between reacting to what your members want and getting ahead of their needs. This is how you spot your biggest advocates, catch at-risk members before they drift away, and build engagement strategies that actually work.
These sophisticated methods move beyond simple labels by factoring in value, timing, and predictive clues. Let’s break down three powerful models that will give you a much richer understanding of your community.
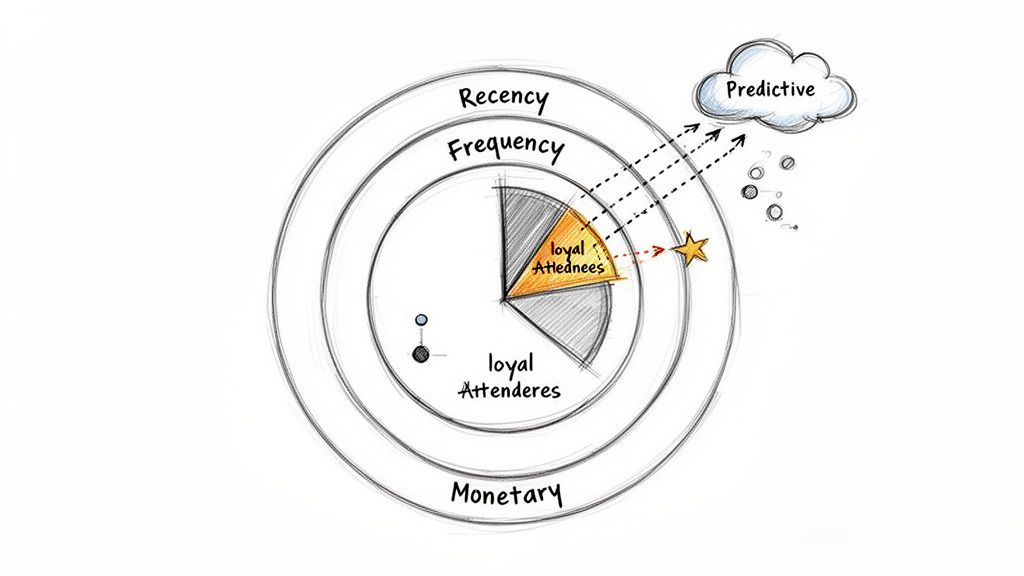
One of the most practical and powerful advanced models is RFM Analysis. It’s a beautifully simple concept that stands for Recency, Frequency, and Monetary value. It helps you pinpoint your best members by looking at three key behaviors.
Think about an event manager digging into past attendee data. Using RFM, they can instantly flag their "Champions"—the people who attended last year's conference (high Recency), have come to 3 events in the past two years (high Frequency), and always spring for the VIP pass (high Monetary).
This group is pure gold. You can now roll out the red carpet for them with an exclusive early-bird discount, invite them to a special pre-conference dinner, or ask for a killer testimonial. Just as importantly, RFM also shines a light on your "At-Risk" members—those with low scores across the board. That's your cue to launch a targeted re-engagement campaign, and fast.
While RFM zeroes in on transaction history, Value-Based Segmentation zooms out to capture the bigger picture. This approach groups people based on their total value to your organization, which often goes far beyond dollars and cents.
A member's real value might lie in their influence, their potential to refer others, or their active contributions to the community. This model helps you look past the balance sheet and see who provides immense strategic worth.
For a professional association, this is a game-changer for finding sponsors. A big company might only have a few individual members paying dues, but their potential value as a top-tier sponsor is massive.
With value-based segmentation, you can easily identify:
Once you’ve identified these high-value segments, you can focus your resources where they’ll have the biggest impact, creating personalized outreach for sponsorship deals or partnership programs that will drive serious growth. To better understand how these different groups interact with you, a deep dive into customer journey analytics can provide some incredible insights.
This is where segmentation gets really exciting. Predictive Models use machine learning and AI to crunch massive amounts of data and forecast what’s likely to happen in the future. Instead of just describing past behavior, they tell you what’s probably coming next.
The rise of AI in segmentation since the 2010s has been transformative. These models can look at everything—demographics, past purchases, online clicks, content views—to predict things like churn risk, purchase likelihood, and customer lifetime value (LTV) with stunning accuracy. They can create tiny "micro-segments," like predicting a member's three-month LTV or their odds of converting from a specific email, letting you focus your efforts on the people most likely to respond.
For associations, this opens up a whole new world of proactive strategy:
Of course, getting these advanced models to work requires clean, organized data. Overcoming common https://groupos.com/blog/data-integration-challenges is the critical first step. Once you're there, these techniques allow you to shift from being reactive to truly proactive, empowering you to make smart, data-driven decisions that build a stronger, more engaged community.
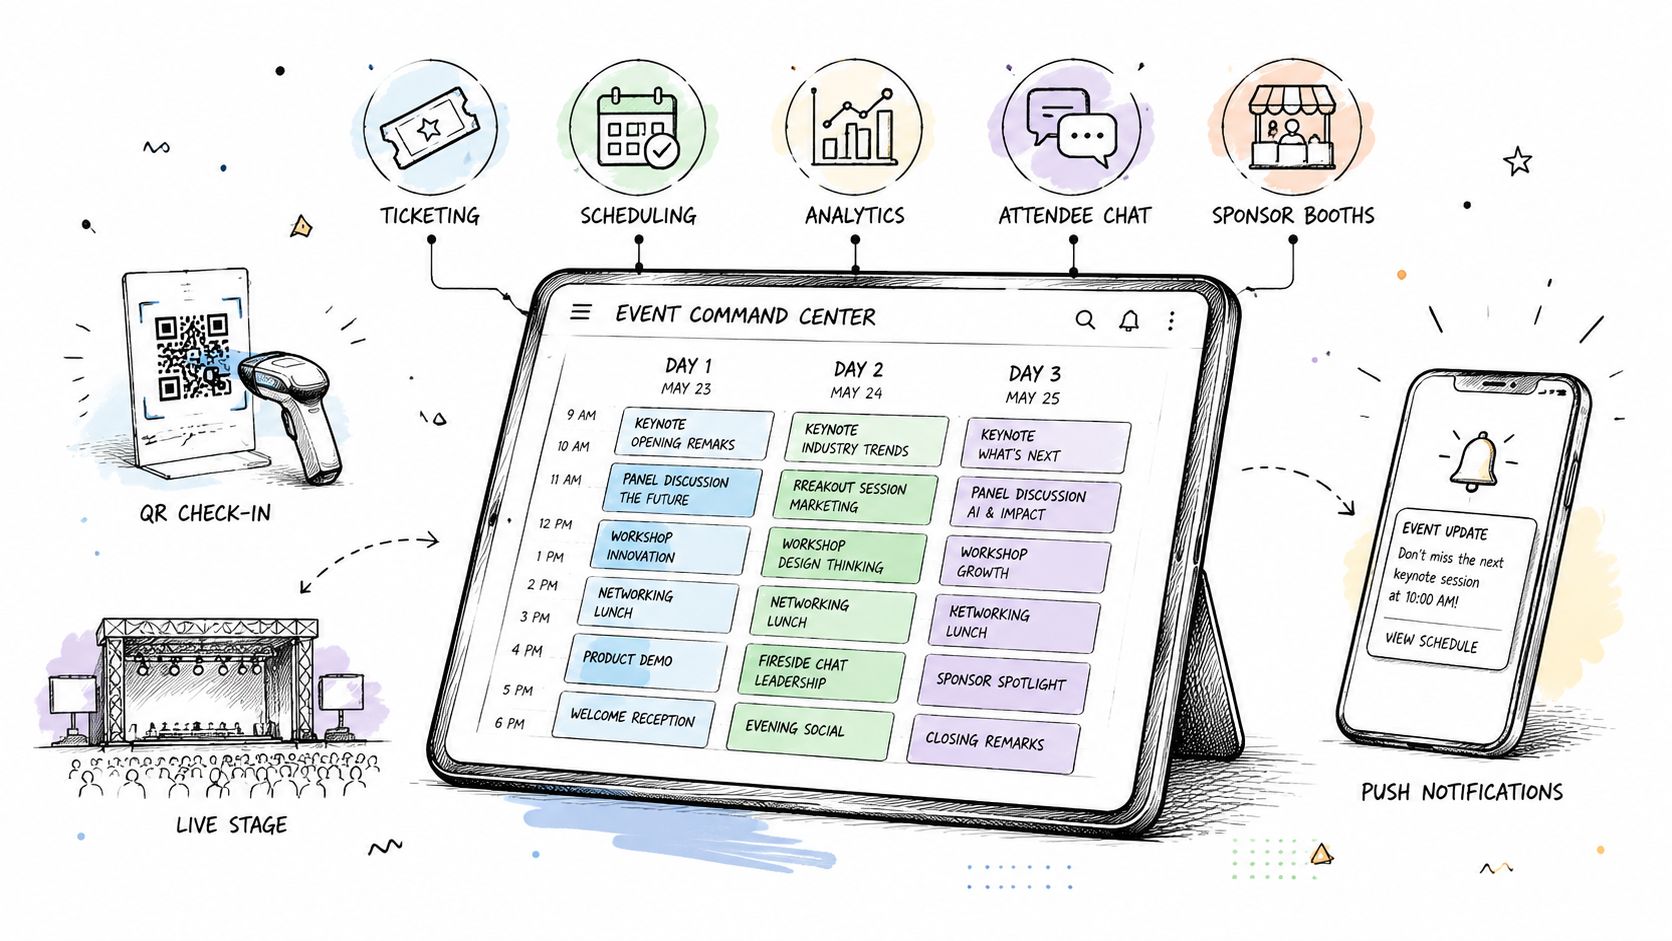
Knowing the theory behind segmentation models is great, but the real magic happens when you put them into practice. This is where you turn those abstract groups into living, breathing segments inside the tools you use every day. With a platform like GroupOS, you can create a seamless system that not only captures the right data but lets you act on it instantly.
This process doesn't start with an email campaign. It begins the moment a new member or attendee enters your world, by making sure you're gathering the right information from the very first hello.
Great segmentation is built on great data. It’s that simple. If you're not collecting meaningful information, even the most sophisticated model is just a shot in the dark. Your registration and sign-up forms are your gold mines.
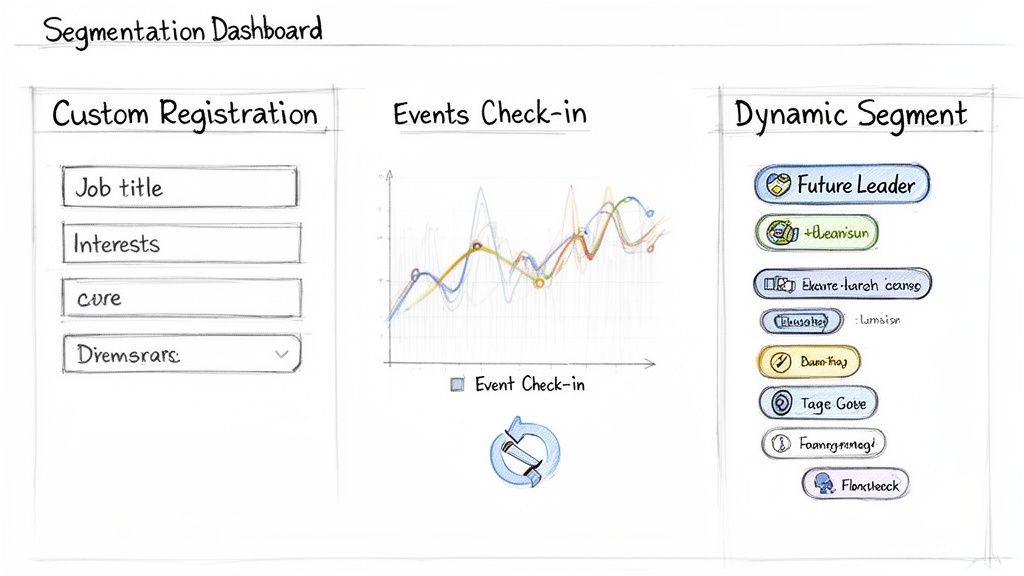
Think beyond the basics of name and email. By using custom registration forms, you can collect key details that feed directly into your segmentation strategy.
This initial data grab lays the foundation for everything that follows, making it much easier to build powerful segments down the road.
Once someone is part of your community, their actions speak louder than words. This is where a solid analytics dashboard becomes crucial for turning clicks, event check-ins, and content views into actionable behavioral segments. You get to see what people actually do, not just what they said they would.
Look for trends in how people interact with your offerings. These actions are powerful clues about their real interests and level of commitment.
Key Takeaway: Behavioral data is your best predictor of what someone will do next. By tracking activities like content downloads, session attendance, and community forum posts, you can build dynamic segments that reflect what your members truly care about.
For instance, you’ll quickly notice a group that consistently attends your live virtual events and another that only consumes on-demand recordings. Now you can send webinar invites to the first group and updates on your content library to the second. It’s a simple switch, but it makes your communication feel personal and relevant. To go deeper, see how top-tier customer engagement solutions can help you monitor and react to these valuable signals.
You've collected the data and you're tracking behavior—now it's time to bring it all together. A flexible tagging system is the tool that makes this happen. Tagging lets you apply specific labels to members based on any mix of their demographic, behavioral, or psychographic data.
Unlike static email lists, tags create dynamic segments that evolve in real-time. A member tagged as "Newbie" might automatically earn the "Power User" tag after attending three events and downloading five resources.
Let's walk through a real-world example for an association.
Example: Creating a "Future Leaders" Segment
Suppose you want to launch a special program for emerging leaders in your industry. Using a tagging system in GroupOS, you can layer different data points to pinpoint this exact group.
Boom. You've just created a hyper-targeted "Future Leaders" segment. You can now send this group exclusive invitations to mentorship programs or advanced workshops, confident that your message will hit the mark because it’s backed by solid data.
It’s one thing to understand the theory behind customer segmentation, but it’s another thing entirely to see it in action. The real power of these models comes to life when we look at how actual organizations use them to solve real problems, connect with their audiences, and drive growth.
Let's dig into three scenarios where associations and event managers turned segmentation insights into some serious wins. Each story breaks down the challenge they faced, the strategy they used, and the impressive results they achieved.
A national professional association was struggling with a problem that kept them up at night: member churn. Renewal rates were slipping, and their standard, one-size-fits-all email reminders just weren't cutting it. They realized they were shouting into the void, failing to address the why behind the drop-offs.
The Challenge:
They needed to stop the bleeding. The goal was to identify at-risk members before they decided to walk away and find a way to bring them back into the fold.
The Strategy:
The team turned to behavioral segmentation. They started tracking key engagement signals inside their community platform—things like how often members logged in, if they attended webinars, downloaded resources, or chimed in on forums. This data painted a clear picture, allowing them to create a brand-new segment called "Disengaged Members." These were folks who hadn't logged in or interacted with anything in over 90 days.
Instead of hitting this group with another generic "please renew" email, they launched a targeted re-engagement campaign. The emails were personal, highlighting the value they were missing out on, like recordings of popular sessions or special invites to an exclusive virtual networking event.
The Outcome:
The results were incredible. This targeted campaign led to a 25% reduction in churn from that disengaged segment within just six months. By paying attention to behavior, the association was able to proactively solve a huge problem and remind their most vulnerable members why they joined in the first place.
Imagine you're running a major tech summit and you want to sell more of your premium VIP ticket packages. For years, you’ve blasted the offer to your entire email list, but the conversion rate has been just… meh. You know there are people who would jump at the chance for VIP perks, but you’re not reaching them effectively.
The Challenge:
The goal was clear: sell more VIP tickets by finding the right people and giving them an offer they couldn't refuse.
The Strategy:
This is where a savvy conference organizer combined two powerful models: RFM (Recency, Frequency, Monetary) and psychographic segmentation. First, they crunched the numbers on past attendees. They built a "Loyal Champions" segment—people who had attended multiple events (high Frequency), signed up for the most recent one (high Recency), and had a history of buying higher-priced tickets (high Monetary).
But they didn't stop there. They layered on psychographic data from post-event surveys, pinpointing which of these champions listed "networking with speakers" and "exclusive access" as their top priorities. Now they had a hyper-targeted list of high-value, highly motivated buyers. This group received a special email offering an exclusive 48-hour early-bird window to snag VIP tickets before anyone else.
The Outcome:
It worked like a charm. The exclusive, time-sensitive offer created a sense of urgency and prestige that was a perfect match for this audience. The conference saw a massive 40% increase in VIP ticket sales compared to the previous year, which gave their overall event revenue a serious boost.
A community manager was gearing up for a huge virtual summit. The audience was diverse, with professionals from all sorts of industries. Feedback from the last event was a bit rough—attendees felt the content was too broad and didn't speak to their specific day-to-day challenges.
The Challenge:
The mission was to make attendees feel like the event was built just for them by delivering more relevant, specialized content. In short: boost satisfaction scores.
The Strategy:
The manager leaned on firmographic segmentation. It was a surprisingly simple but effective move. They added one mandatory field to the registration form: "What is your industry?" (e.g., Healthcare, Finance, Technology). Armed with this data, they created distinct segments for each major industry.
This allowed them to organize the summit agenda into tailored "industry tracks." A healthcare professional got an alert about a panel on patient data security, while someone in finance was notified about a can't-miss talk on fintech innovations. No more generic blasts.
The Outcome:
The post-event survey told the whole story. Attendee satisfaction scores skyrocketed, with a 35% jump in ratings for content relevance. By using simple firmographic data, the manager transformed a generic event into a valuable, must-attend summit for each industry group.
Alright, you've put in the work and built out your customer segmentation models. That’s a huge step, but it’s not the finish line. Think of segmentation as a living strategy, not a one-and-done project. To get real value, you have to keep a close eye on what’s working, adapt to new insights, and avoid the common traps that can trip you up.
Imagine your segments are different gardens. You wouldn't use the same watering schedule for a patch of desert succulents and a bed of tropical flowers, right? In the same way, you need to monitor each customer segment with metrics that fit its unique personality and goals. Only then can you help it truly thrive.
To know if your strategy is actually working, you have to track the right numbers. Vague, high-level metrics won't cut it; they don't tell the whole story. You need to get granular and focus on segment-specific key performance indicators (KPIs) that show exactly how different groups are responding to your efforts.
Effective measurement starts with clarity. Pinpoint what you want to achieve with each segment. Is it boosting engagement? Improving retention? Driving more conversions? Once your goal is crystal clear, you can pick the right KPIs to see how you’re doing.
Here are the essential metrics to keep on your dashboard:
As you get more sophisticated with your segmentation, be aware of a few classic pitfalls that can completely undermine your success. Knowing what to watch out for is half the battle.
The biggest mistake is treating segmentation as a purely analytical exercise. The goal isn’t just to create perfect segments; it’s to take meaningful action based on the insights they provide.
Here are three critical mistakes to avoid:
By continuously measuring your results and steering clear of these common errors, you can ensure your segmentation strategy stays agile, effective, and perfectly aligned with your organization’s goals.
Ready to turn insights into action and build a thriving, engaged community? GroupOS provides the all-in-one platform you need to capture the right data, build dynamic segments, and deliver personalized experiences that drive growth.