October 24, 2025

The retention ratio, sometimes called the "plowback ratio," is a simple yet powerful metric. It tells you exactly how much of your company's net income is being reinvested back into the business instead of being paid out to shareholders as dividends.
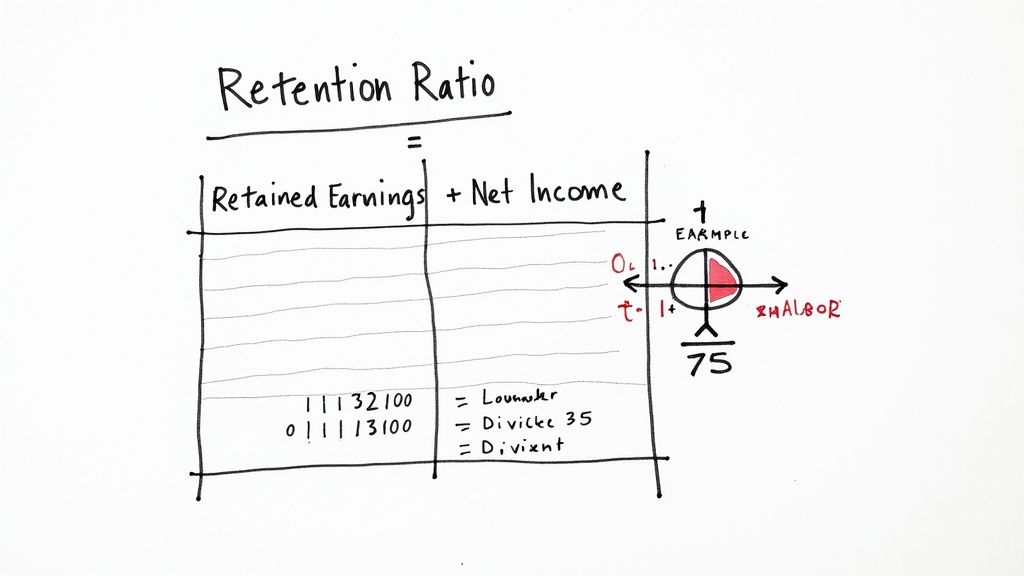
The core formula is surprisingly straightforward: (Retained Earnings) ÷ (Net Income). This one calculation gives you a clear window into a company's growth strategy.
So, how do you figure this out for your own organization? Whether you're a large corporation or a local community group, understanding your retention ratio is key to seeing where your money is going. It answers a critical question: "How much of our profit are we actually putting back into the tank to fuel future growth?"
A high ratio usually means the focus is on reinvestment—think expansion, new projects, or R&D. A lower one often signals that the priority is giving value back to shareholders or members right now through dividends.
To get your number, you just need two key figures from your financial statements:
Subtract the dividends you paid out from your net income, and what's left is your retained earnings. That’s the money the company keeps.
As you can see, the retention ratio and the payout ratio are two sides of the same coin. When you add them together, they should equal 100% of your net income.
Before you start crunching numbers, it helps to have a clear picture of the components you'll be working with. I've broken them down in the table below.
Having these three figures handy makes the calculation a breeze. Once you’ve nailed down this basic framework, you’re well on your way to making more informed strategic decisions.
For a more detailed walkthrough, including different scenarios and examples, this is a comprehensive guide to customer retention rate calculation that I often recommend.
Your retention ratio calculation is only as strong as the data you feed it. We've all heard the old saying, "garbage in, garbage out," and it's especially true here. If your numbers are a mess, the final ratio will be pretty much useless.
So, where do you actually pull this information from? Your best bet is to look in a few key places.
Start with the systems you already use every day. Your most reliable data sources will likely be:
The biggest mistake I see people make is using mismatched timeframes. You have to make sure every piece of data—from your CRM to your financial reports—covers the exact same period, whether that's Q2 or the entire last year.
I can tell you from experience that the most trustworthy numbers come from cross-referencing. Don't just pull a report from one system and call it a day.
For example, I once worked with a community manager who noticed a major gap between the numbers in their accounting software and their CRM. It turned out that by syncing the two, they could pinpoint which members had actually left versus those who just had a failed payment. That small step completely changed their churn numbers for the better.
A retention ratio is only as good as the data it's built on. Take the extra time to validate your numbers by comparing reports from different systems; it will save you from making strategic decisions based on flawed insights.
This isn't just about getting the numbers right; it's about understanding the story behind them. When you start comparing different datasets, you begin to see how financial trends connect directly to specific member activities. For more on what to track, our guide on essential community engagement metrics is a great place to start.
Don't forget about your loyalty program data, either. It can be incredibly insightful, but you have to interpret it carefully. The loyalty industry is massive—valued at over $10.67 billion—and while incentives are powerful, you need to measure genuine loyalty, not just discount-chasing. You can find more stats and customer retention trends on sprinklr.com.
Ultimately, your goal is to build a dataset you can stand behind with 100% confidence.
Once you've gathered your numbers, calculating your retention ratio is actually pretty straightforward. The real work is ensuring your data is clean and consistent. You’re simply plugging your net income and dividend figures into the formula.
Let's walk through a real-world example. Imagine a local sports club that finished the year with a net income of $100,000. From that, they paid out $25,000 to members as part of a profit-sharing plan. This leaves $75,000 in retained earnings, giving them a retention ratio of 75%. That's a healthy number, showing they're reinvesting three-quarters of their profits back into the club.
Trying to track this manually can get messy. This is where dedicated tools come in handy; our guide on membership management software explores how certain platforms can automate this kind of financial tracking for you.
The process of getting to that final calculation involves pulling data from a few different places, as this infographic shows.
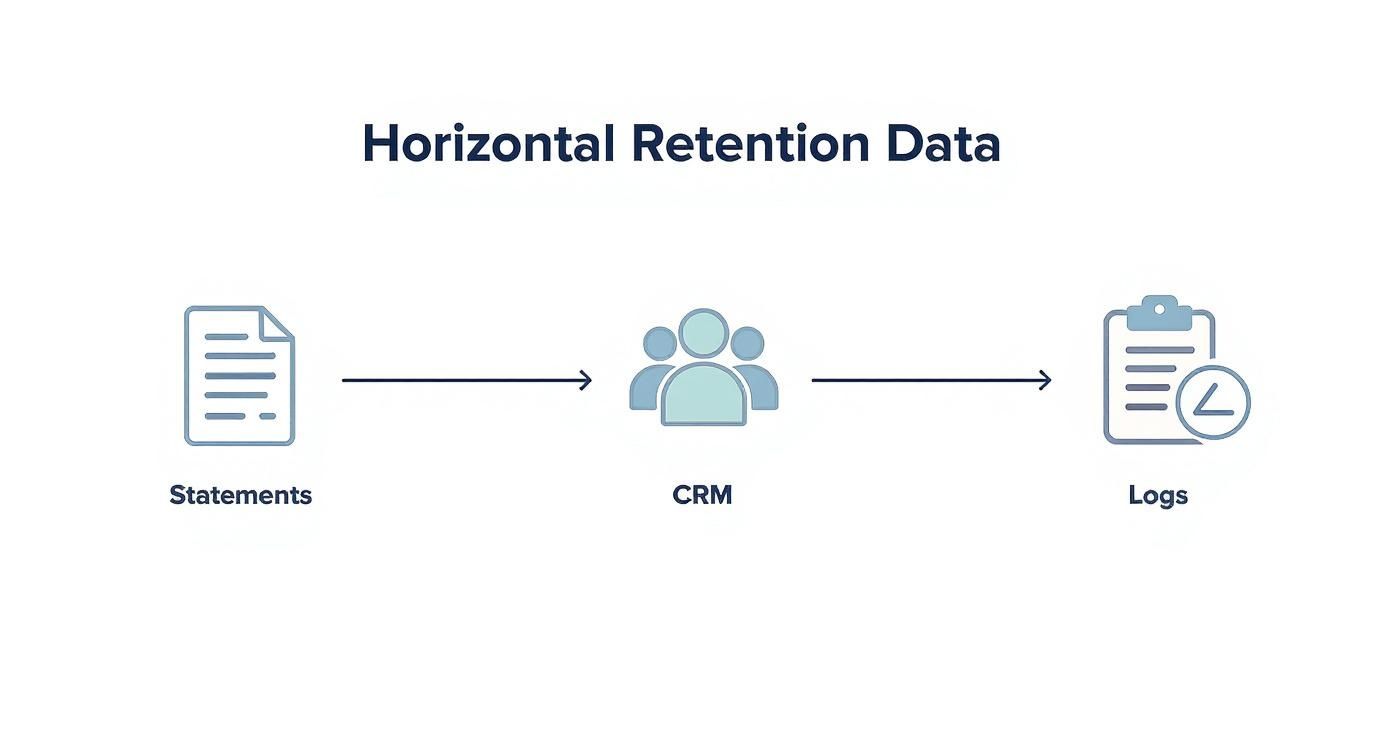
As you can see, accurate financial statements, your CRM, and event attendance logs are all crucial inputs for getting a number you can trust.
Here’s the thing: there’s no magic number. A "good" retention ratio depends entirely on your industry and your organization's goals. A fast-growing tech startup might keep 80% or more of its earnings to fuel development, while a mature, stable utility company might have a much lower ratio because it prioritizes paying dividends.
To get a clearer picture of where you stand, it's helpful to compare your numbers against industry benchmarks.
This table offers a snapshot of typical retention ratios across different sectors. Keep in mind that these are averages, and your own goals might lead you to target a higher or lower number.
Seeing these numbers provides crucial context. If you're running an industrial group and hitting 70%, you're right in line with expectations. If you want to dive deeper into the nuts and bolts, there are some great resources out there on mastering the customer retention rate calculation formula.
Ultimately, context is everything. Your retention ratio is more than just a number—it’s a reflection of your strategy. Are you in a growth phase, or are you focused on rewarding your members and stakeholders? Answering that question is the key to interpreting your result.
So, you've run the numbers and have your retention ratio. Great! But what does that percentage actually tell you? On its own, a number is just a piece of data. The real story emerges when you put it into context.
For example, a 70% retention ratio might be cause for celebration for a growing annual conference that's constantly reinvesting to attract bigger, better speakers. But for a mature, well-established subscription service, that same 70% could be a warning sign of stagnation. It’s all about perspective.
Your industry is the biggest piece of that perspective. Retention benchmarks swing wildly from one sector to another. You’ll see media and professional services leading the pack at around 84% globally, while retail typically hovers closer to 63%. Hospitality often lands even lower, around 55%.
These numbers aren't just trivia; they're your baseline. They show that what’s considered fantastic in one industry might just be average in another. You can discover more insights on customer retention benchmarks to see exactly how your own organization stacks up.
Let's look at a couple of real-world examples:
A low retention ratio isn’t automatically a disaster. Think of it as a signal to start asking the right questions. Are members jumping ship to a competitor? Is our value proposition falling flat? Are we putting our resources in the right places to keep people engaged?
Ultimately, understanding your retention ratio is about turning a percentage into a plan. A dipping number is your cue to take a hard look at your engagement strategy and overall value. If you're seeing numbers that concern you, our guide on how to reduce churn rate is packed with practical steps. This is how you transform a simple metric into a powerful tool for growth.
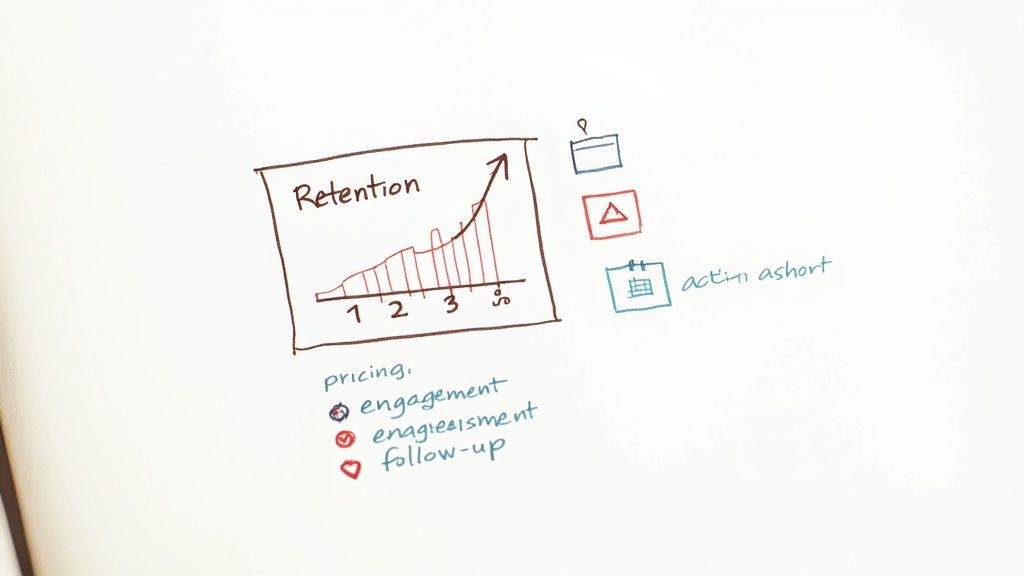
Okay, so you've calculated your retention ratio. Now what? This is where the real magic happens—turning that number into action. Getting this metric is one thing, but using it to make smart, strategic changes that boost your bottom line is the real goal.
For any membership-based group, a slipping retention ratio is a major red flag. It’s a clear signal that something isn't connecting. Maybe your pricing tiers are off, or perhaps the benefits that once seemed essential are starting to feel a little stale. This data helps you stop guessing and start digging into the root cause of why people are leaving.
Let's look at a real-world example. I once worked with a nonprofit that was puzzled by a retention dip over two straight quarters. After digging into the numbers, we found the culprit: their mid-tier membership just didn't offer enough value to justify the price jump from the basic plan. It was a classic case of "why bother upgrading?"
So, they revamped their pricing. They added exclusive content and early-bird access to events specifically for that mid-tier. The payoff was huge—a 12% year-over-year jump in member retention. It’s a perfect example of how a single metric can guide you to a powerful, profitable change.
This same thinking works beautifully for events. If you're tracking how many people return for your annual conference, you can start refining your strategy with incredible precision. For a more detailed breakdown, our guide on how to measure event success gives you a great framework for tracking all the right KPIs.
Think of your retention ratio as less of a grade and more of a diagnostic tool. It empowers you to ask better questions. "Which speaker lineup brought the most people back next year?" or "Did that post-conference email series actually encourage re-registration?"
To make this practical, I recommend setting up a simple dashboard. Keep an eye on your retention ratio monthly and annually, right alongside your other key engagement metrics. This gives you a complete picture of your community’s health, turning numbers on a screen into a clear roadmap for growth. Consistent monitoring like this helps you spot a downward trend long before it becomes a crisis.
When you're digging into retention numbers, it's surprisingly easy for a small mistake to throw everything off. I've seen it happen time and again. One of the most common traps is comparing apples to oranges with your timeframes.
For example, you can't get a clear picture by plugging your net income from Q4 into a formula that uses membership data from the entire fiscal year. The periods you're analyzing for both your financial data and your member data have to line up perfectly.
Another classic error is not accounting for one-time financial blips. A big, unusual expense can temporarily tank your net income, which then makes your retention ratio look artificially high. You have to smooth out those anomalies to see the real trend.
You also need to be meticulous about how you classify money going out the door. Let's say your organization sold off an old asset and paid out a special dividend. That's a totally different beast than a regular dividend from operational profits, and mixing them up will definitely skew your results.
Keep an eye out for these specific tripwires too:
Here's a simple gut check I always use: "Does this number reflect the day-to-day health of our operations, or is it an outlier?" Asking that one question can stop you from making a major decision based on bad data.
Even once you’ve got the hang of calculating retention ratios, a few questions tend to resurface. Let’s clear up the most common sticking points so you can move forward with confidence.
The retention ratio shows how much of your net income you’re plowing right back into your organization. On the flip side, the payout ratio tells you what percentage goes out as dividends or member rewards.
Together, they always total 100%. For example, if you keep 70% for growth, you’re handing out 30% to stakeholders.
Your decision to tilt toward reinvestment or dividends speaks volumes about your strategy. Are you chasing rapid expansion or rewarding members right away?
There’s no one-size-fits-all answer. Many membership groups find a quarterly check-in gives them a solid performance snapshot without drowning in data.
Mixing currencies can muddy the waters, but consistency is your friend. Before you run the numbers, pick one base currency—say USD or EUR—and stick with it throughout.
That way, your retention ratio remains crystal clear, no matter how many currencies roll in.
Ready to turn these insights into action? GroupOS provides the all-in-one platform you need to track member engagement, manage event data, and make data-driven decisions. Streamline your operations and focus on growth by visiting https://groupos.com.