February 9, 2026

Data on its own is just noise. The real magic happens when you turn that noise into a clear signal, and that’s what analytics and insights are all about. It’s the art of taking raw numbers—ticket sales, content views, member comments—and weaving them into a story that tells you exactly what to do next to grow your community.
Let's be honest, staring at a dashboard full of metrics can feel like trying to drink from a firehose. You’ve got numbers pouring in from event registrations, video plays, and community chats. The biggest hurdle isn't getting the data; it's figuring out what it actually means for your strategy. The goal is to stop just reporting what happened and start understanding why it happened.
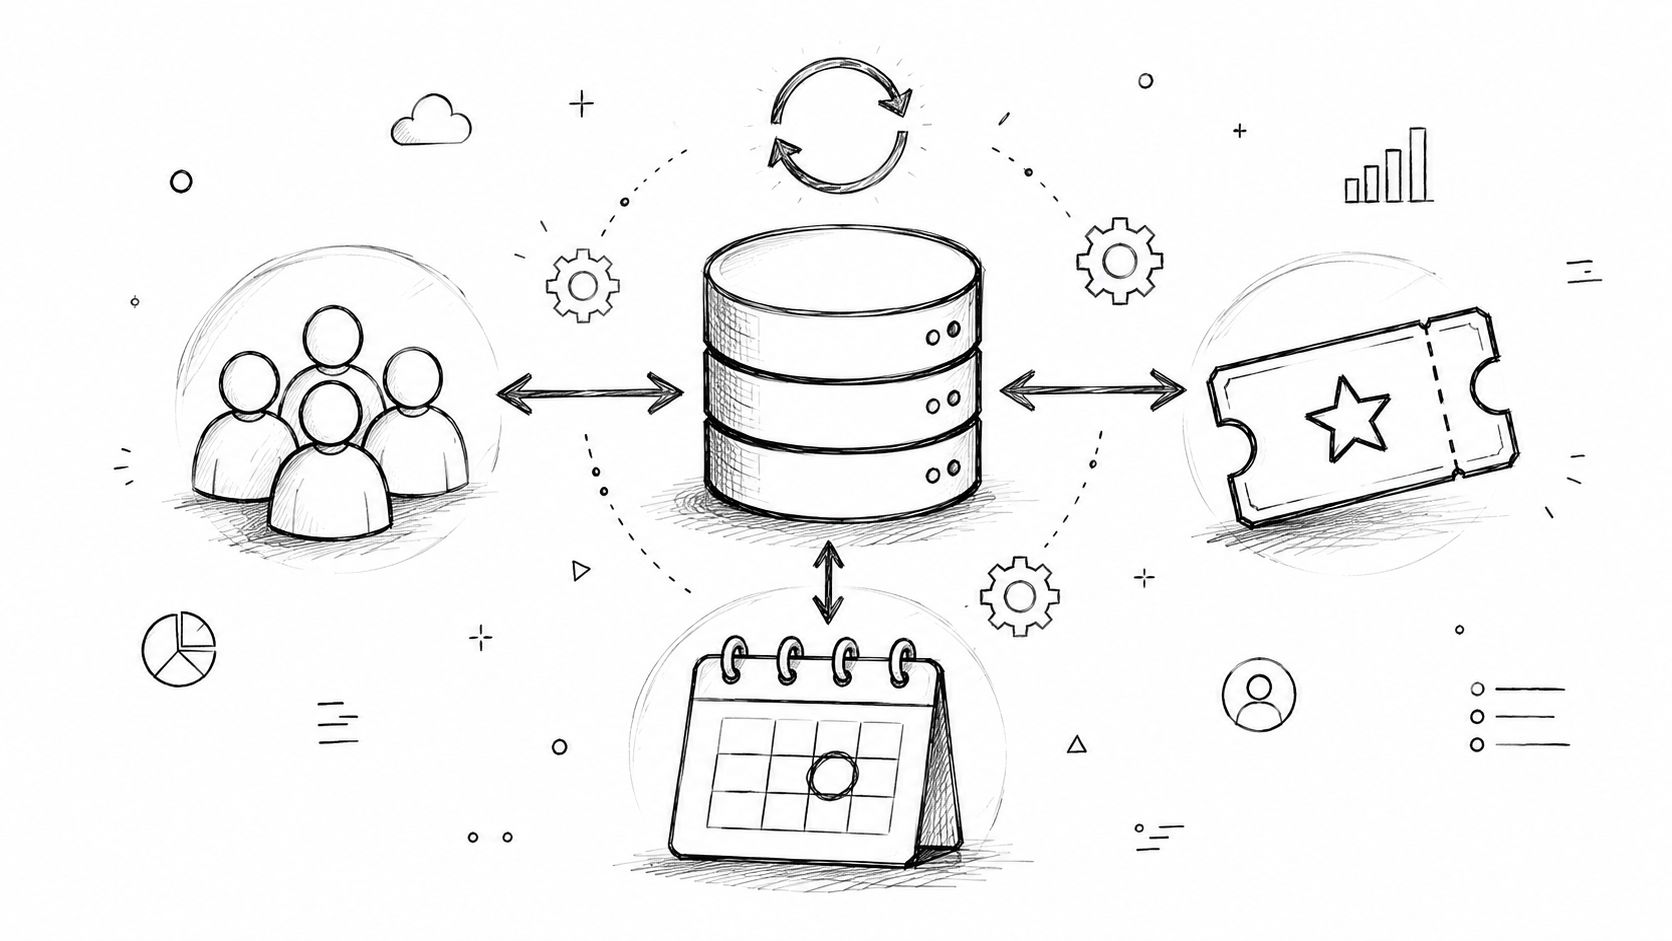
This is where a unified platform like GroupOS really changes the game. Instead of patching together insights from a dozen different spreadsheets and disconnected tools, you get a single, coherent picture. All the data from your content hub, membership portal, and event ticketing flows into one place, making it so much easier to connect the dots.
When your data is scattered everywhere, you’re only seeing small, disconnected pieces of your member's journey. Sure, you might know how many tickets you sold, but can you pinpoint the exact piece of content that pushed someone to click "buy"? A unified view helps you answer the questions that really matter:
This connected approach helps build a data-informed culture. Every decision, from planning your next workshop to launching a new content series, can be backed by real evidence. When you're dealing with qualitative feedback from webinars or virtual events, turning that spoken content into something you can analyze is a game-changer. That's where tools like audio to text transcription services can be incredibly helpful for converting valuable feedback into searchable, analyzable text.
Key Takeaway: Real insight comes from seeing the whole story. When you bring all your data sources together, you stop guessing and start building a predictable engine for growth. Analytics becomes your steering wheel, not just a rearview mirror.
This shift isn't just a trend; it's a fundamental change in how businesses operate. The global analytics market was valued at an impressive USD 6.95 billion in 2024 and is expected to more than double to USD 15.22 billion by 2032. This incredible growth highlights just how critical analytics and insights have become for staying competitive. You can dive deeper into the future of the analytics market to see where things are headed. This solid foundation doesn't just help you understand the past; it empowers you to confidently shape the future.
Now, let's talk about the specific metrics you should be watching. It's easy to get lost in vanity metrics, so I've put together a table of the KPIs that truly move the needle for community and event-led growth.
This table isn't exhaustive, but it's the perfect starting point. Focusing on these core areas will give you a powerful snapshot of your community's health and point you toward the biggest opportunities for growth.
Think of your analytics dashboard as your mission control. If it’s messy and cluttered, you'll be flying blind. But a clean, well-organized dashboard gives you instant clarity on what’s happening in your community. Getting your GroupOS environment set up correctly from the get-go is the single most important thing you can do to capture data that actually means something.
Your first move is to connect all your data sources. A truly useful dashboard doesn't just look at one platform; it pulls information from every place your community interacts. With GroupOS, you can easily integrate channels like Slack and Facebook, which means all those conversations, reactions, and engagement metrics flow right into one central analytics engine. This breaks down the data silos and gives you a holistic view of member activity. Trust me, spending a little time sorting out common data integration challenges now will save you a world of headaches later on.
Once everything is connected, it’s time to decide what you actually want to see. Every community is different. An event organizer running a big conference will be laser-focused on ticket sales, while a professional association might care more about how members are engaging with a new content series over the long haul.
This is where GroupOS really shines—it lets you put the KPIs that matter most to you front and center. You can build custom widgets and drag-and-drop your dashboard layout to prioritize things like:
This level of customization turns a generic report into a strategic tool designed specifically for your community’s goals.
The whole idea is to move from just having data to taking smart, informed action.
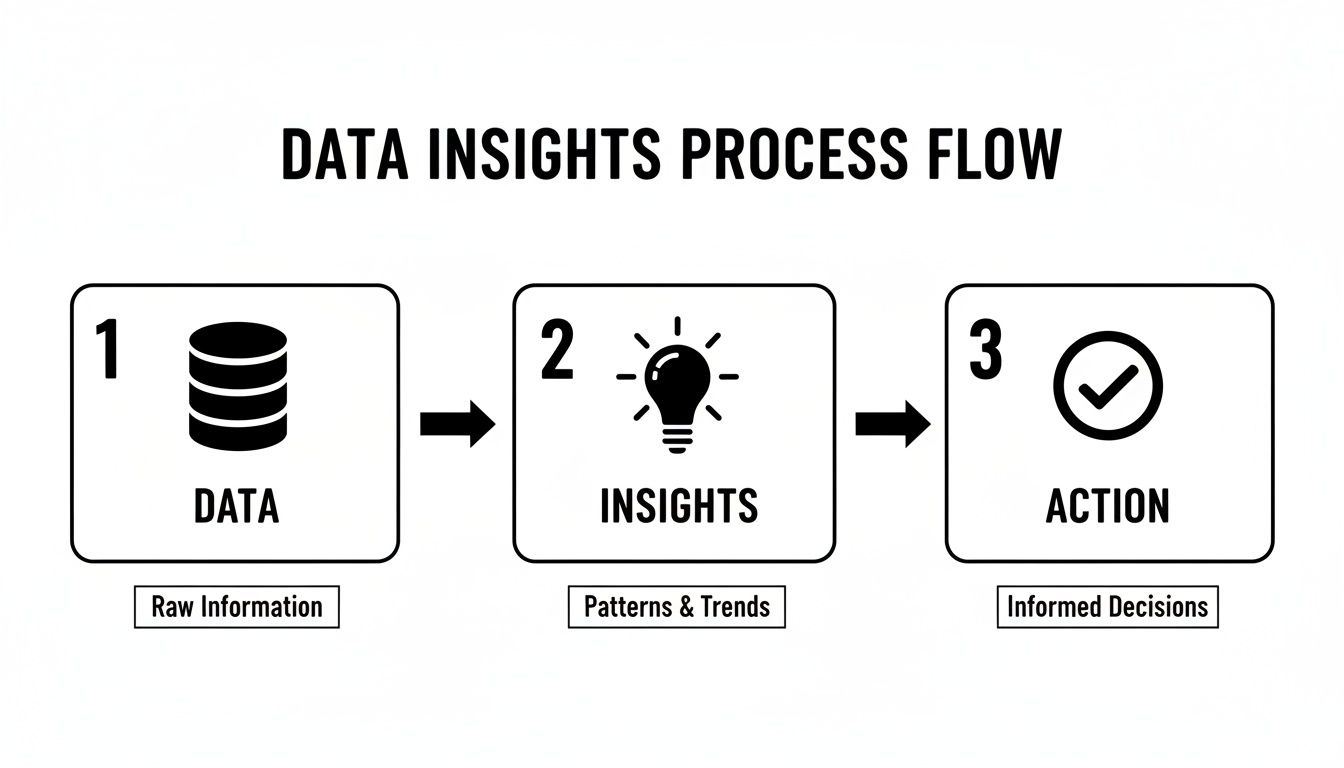
As you can see, data is just the raw material. The real value is found when you can spot patterns and use those insights to make better decisions.
The real power of analytics is unlocked when you can measure the direct return on investment (ROI) of your efforts. With GroupOS, you can set up tracking for specific initiatives to prove what’s working and what’s not.
For example, you could measure conversions from:
This kind of granular tracking elevates your analytics and insights from just passive observation to active business intelligence. You're no longer guessing—you're proving the value of your work.
For instance, a professional association could use their dashboard to see a membership drive take off. By tracking sign-ups coming directly from a webinar series, they can instantly calculate the ROI of their content marketing. At the same time, a tech conference manager could watch ticket sales spike in real-time right after sending a targeted email to a specific member segment.
By the time you finish this setup, you won't just have a dashboard. You'll have a command center, tailored to your needs and ready to give you the insights necessary to grow your community and boost revenue. This foundation is crucial for everything that comes next.
Once you’ve got your dashboards set up and data is flowing in, the real fun begins. It's time to go beyond just glancing at numbers and start understanding the stories your community data is trying to tell you. This is where you turn raw analytics and insights into the kind of intelligence that can genuinely shape your community's future.
Think of your GroupOS dashboard as a living biography of your members. Each metric is just one sentence, and you need to read them all together to get the full story. A classic mistake is looking at metrics in isolation. The real magic happens when you connect the dots between different data points to uncover what your members are really doing and what they actually need.

Let’s walk through a real-world scenario. You log into GroupOS and notice that your interactive member map is getting a ton of clicks, but your discussion forums are a ghost town. What’s that story telling you?
At first glance, dead forums might feel like a failure. But when you pair that with the high map usage, a different picture emerges: your members are far more interested in networking and finding each other locally than they are in long-form digital chats.
That insight is gold. It means you can stop trying to force forum conversations and instead pour that energy into facilitating local meetups or creating regional chapters. This is what data interpretation is all about—moving from what is happening to why it's happening and, most importantly, what to do next.
Your GroupOS reports are built to help you spot these kinds of trends over time. Don't just look at today's numbers; compare them to last week, last month, or even last year. Did event ticket sales start climbing right after you launched that new content series? That's a pretty clear signal your content marketing is hitting the mark.
Keep an eye out for patterns like these:
Expert Insight: The best community managers I know are basically data detectives. They never take a number at face value. They're always asking "why," testing hypotheses, and searching for connections that others might miss. That's how they turn simple data into a strategic roadmap.
The ability to translate these trends into concrete action is what separates a good community manager from a truly great one.
Technology is giving us incredible tools to see around the corner. AI-powered data analytics, which is the engine behind many of GroupOS's more advanced features, is a game-changer. The market for AI in data analytics is projected to hit USD 31.22 billion in 2025 and is expected to rocket to USD 310.97 billion by 2034.
This isn't just abstract growth; it has real-world impact. Organizations are already using predictive models to reduce member churn by 25% or create smarter event forms that get 35% higher registration rates. For more on this trend, check out Precedence Research's market report. This means your analytics and insights are no longer just about what happened yesterday; they can start to predict what will happen tomorrow.
By getting good at interpreting your data, you can spot these opportunities—and threats—long before they fully materialize.
To help you get started, it’s useful to recognize some common data patterns you’ll encounter. Seeing the pattern is the first step; knowing how to react is what drives growth.
Here’s a quick guide to some common scenarios you might see in your GroupOS dashboard and what you can do about them.
Looking for these patterns helps you move from being reactive to proactive. Instead of just reporting on the numbers, you'll be using them to make smarter, more informed decisions that build a healthier and more engaged community.
Collecting data is the easy part. The real work—and the real magic—happens when you start turning those numbers into a concrete plan that actually grows your community. An insight sitting on a dashboard is just trivia; a well-executed action plan is what builds a more vibrant, engaged, and profitable group.
This is where you shift from being a data reporter to a true community strategist. It's about taking an observation, like a dip in event registrations, and building a methodical, measurable response to turn that trend around. Let's walk through a few real-world scenarios to see what this looks like in practice.
You’ve launched a beautiful new content hub filled with great videos and articles, but your GroupOS dashboard is showing you some pretty disappointing numbers. Views are low, and the comment section is silent. The data is telling you there’s a problem. Now, let’s build a plan.
Here's how you could tackle this:
This kind of systematic approach is worlds more effective than just sending another generic "check out our new stuff!" email. It uses data to personalize the push, which dramatically increases your odds of success.
Your annual conference is just six weeks away, and ticket sales are pacing behind last year. It’s tempting to panic, but your member data is your best friend here. The insight is clear: you need to create a sense of urgency and highlight the value.
Here’s how you can turn that insight into a campaign that actually moves the needle on revenue:
The goal is to move beyond generic marketing. You have rich behavioral data at your fingertips—use it! By understanding who your most engaged members are, you can create offers that feel personal and valuable, not like just another sales pitch.
One of the most powerful ways to use analytics and insights is to get ahead of member churn. Let's say your GroupOS dashboard flags a segment of members whose engagement scores have dropped off a cliff in the last 60 days. They haven't logged in, posted a comment, or registered for anything. These members are at risk of leaving.
Here’s a simple checklist for a re-engagement campaign:
By taking these steps, you’re actively working to keep your members around. For even more tactics, check out our guide on how to reduce your community's churn rate. This proactive approach, fueled by predictive data, is what separates a modern, data-driven organization from the rest.
The entire data analytics market is booming for a reason—it’s expected to hit a massive USD 302,006.0 million by 2030. A key driver is this exact shift from just reporting on the past (descriptive analytics) to actively shaping the future (prescriptive analytics). That's precisely what these action plans are designed to do, ensuring you’re not just looking at data, but using it to build a community that thrives.
Once you've got a handle on the basic data, it’s time to level up. You can stop just watching what's happening in your community and start actively shaping its future. This is where advanced analytics and insights come into play, helping you move from a reactive manager to a strategic leader.
These sophisticated techniques, like member segmentation and predictive analysis, aren't just for massive corporations anymore. With a platform like GroupOS, they're right at your fingertips, ready to help you drive some serious growth.
The key is to stop thinking of your community as one big, faceless crowd. It’s not. It’s a collection of smaller groups, each with its own unique interests, habits, and needs. This is the simple but powerful idea behind member segmentation.
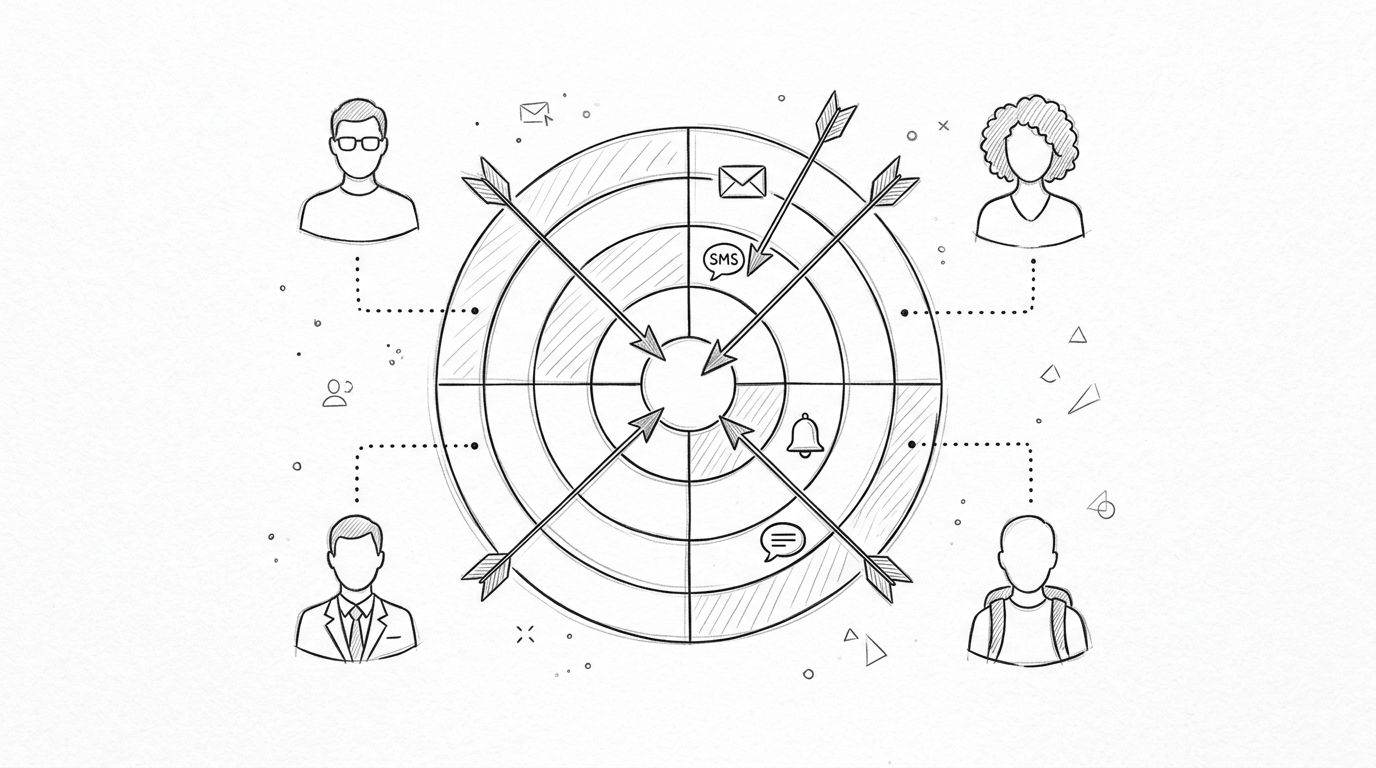
Instead of just grouping people by simple demographics, let's look at what they do. Behavioral segmentation is all about analyzing the actions members take within your community. Using the data inside GroupOS, you can start creating some really powerful segments based on real engagement patterns.
This is how you deliver hyper-personalized communication that actually connects with people. Imagine creating specific groups for:
Creating these segments lets you tailor your messaging, content, and offers with pinpoint accuracy. For a deeper dive, our guide on different customer segmentation models is a great place to start. This targeted approach makes members feel seen and understood, which is a game-changer for building loyalty.
The next frontier is using all that historical data to predict what’s coming next. Predictive modeling isn't about gazing into a crystal ball; it's about using past behavior to make incredibly smart guesses about the future. GroupOS is already collecting the data points you need to start asking these powerful, forward-looking questions.
So, what can you actually predict?
This shift from looking in the rearview mirror to looking at the road ahead is what separates good community managers from great ones. It empowers you to solve problems before they arise and seize opportunities before they become obvious.
As you start exploring these methods, it helps to understand what's going on under the hood. For community leaders who really want to get into the weeds, this practical guide to AI for data analysis offers some powerful techniques for turning raw data into this kind of actionable intelligence.
Finally, let's talk about one of the most critical advanced metrics out there: Member Lifetime Value (LTV). Simply put, LTV is the total revenue you can expect from a single member over the entire course of their relationship with your community.
Getting a handle on this number is huge. It puts your acquisition costs into perspective and shows you exactly where to focus your retention efforts.
Calculating LTV means looking at things like average membership duration and the total revenue each member generates (from subscriptions, event tickets, courses, you name it). Once you have a baseline number, the goal is always to increase it. And those segments you created earlier? They’re your secret weapon.
By analyzing the LTV of different segments, you'll almost certainly find that a small percentage of your members—like your "frequent event attendees"—are driving a massive chunk of your revenue. These are your MVPs (Most Valuable People).
Your analytics and insights will show you who they are and what makes them tick. The secret to scaling is to double down on what works for this group and figure out how to nurture other members into this same high-value segment.
Jumping into the world of analytics and insights always brings up a ton of questions. You’ve got the tools, the data is coming in, but what’s next? How do you actually use this stuff day-to-day without getting lost in a sea of charts?
Let's cut through the noise and tackle some of the most common questions I hear from community and event managers who are just getting their hands dirty with data. This isn't about theory; it's about giving you practical answers you can use right away.
When you first log into your GroupOS dashboard, the sheer amount of data can feel like you're trying to drink from a firehose. It’s a common feeling. The secret is to ignore most of it, at least for now.
Don't try to track everything at once. Instead, zero in on a few core metrics that give you a quick, high-level read on your community's health. Think of these as the vital signs.
Here are the three I always recommend starting with:
Nail these three down first. Once you have a solid feel for your baseline performance, then you can start exploring the more granular analytics and insights.
Finding the right rhythm for checking your data is key. If you're glued to your dashboard 24/7, you'll drive yourself crazy reacting to every little dip and spike. But if you only check it once a quarter, you’ll miss crucial trends.
The best approach is a tiered one. Some gauges you glance at often, others you study more deeply but less frequently.
The biggest mistake I see is treating all data with the same level of urgency. Setting a clear review schedule helps you focus on what really matters at that moment, so you can stay strategic without getting buried in data.
This is the big one, right? The question we all get from our boss or stakeholders. And the answer is an emphatic "yes." With a platform like GroupOS, you can draw a straight line from your community efforts to real business results.
Of course, you can and should track the obvious stuff: membership fees, event ticket sales, and sponsorship packages. Those are your direct ROI wins, and they're easy to calculate.
But the real magic happens when you start tracking the behaviors that lead to that revenue. Your dashboard helps you connect those dots. For instance, you can finally answer questions like:
Being able to link specific engagement patterns directly to revenue is how you prove the incredible value of what you’re building. It’s what turns your community from a "nice-to-have" line item into an engine for business growth.
Ready to stop guessing and start growing? GroupOS gives you all the tools you need to turn your community data into powerful insights that drive engagement, retention, and revenue.
Start your free trial today and see what a data-driven community can do.