July 16, 2025

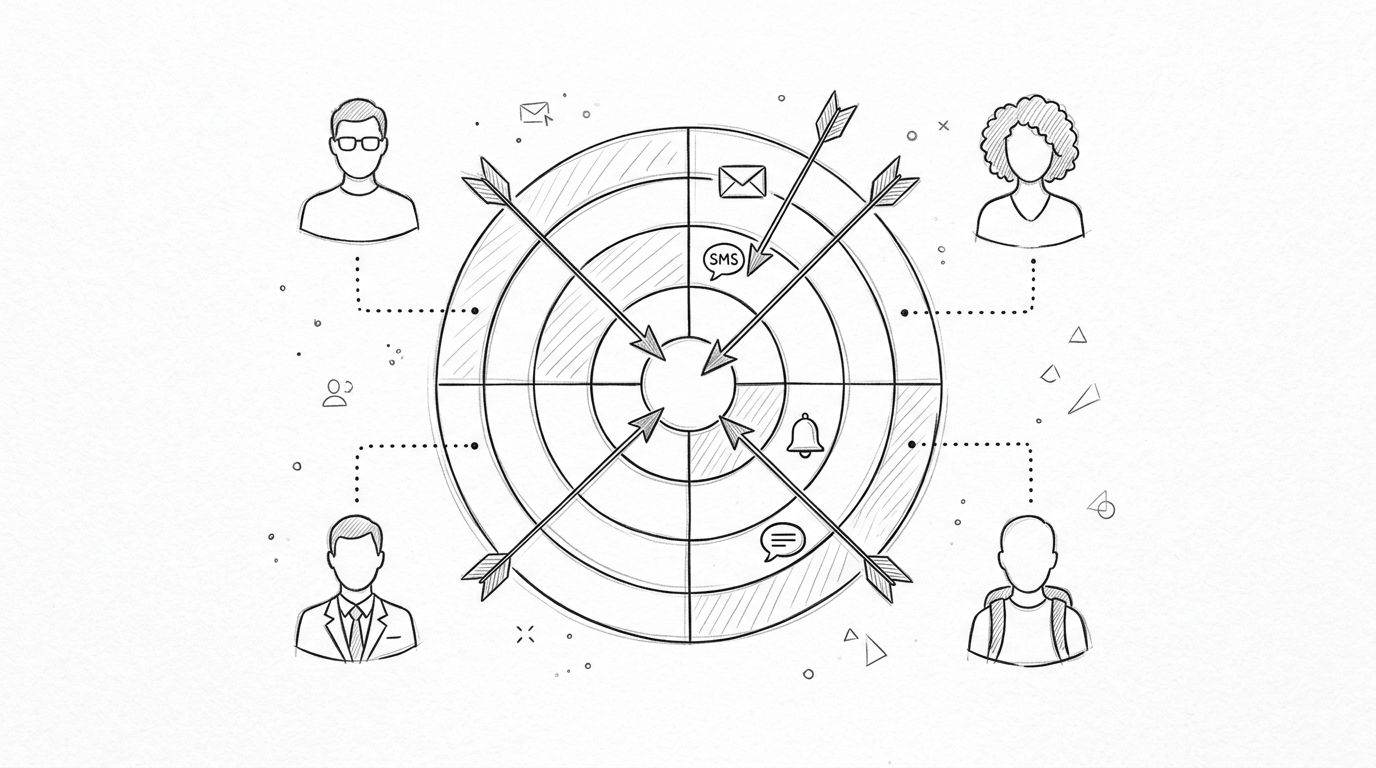
So, what are community engagement metrics, really? At their core, they’re the vital signs of your online community. These are the key performance indicators that tell you how healthy, active, and valuable your community is. We're not just counting heads here; we're measuring the quality of interactions, how deeply members are participating, and the real impact your community has on your business goals.

Let's be honest—for a long time, social media metrics felt like staring at the tip of an iceberg. You could see the surface-level activity, but the real substance, the true value, was hidden just out of sight. Success used to be all about follower counts and likes, numbers that were easy to track but incredibly difficult to tie back to actual business outcomes.
But times have changed. Today's business leaders want to know more. They’re asking how the community directly contributes to the bottom line—things like improving customer retention, generating leads, or even reducing support costs. This demands a complete shift in how we think about and measure community success.
Vanity metrics are those numbers that look fantastic in a report but offer very little strategic insight. Picture a social media page with a massive follower count, but every post is met with crickets—almost no comments or shares. Sure, the audience is large, but is anyone actually listening? Is anyone doing anything?
These metrics are misleading because they don't capture the true pulse of a community. A high number of registered users is meaningless if only a tiny fraction ever logs back in, let alone posts or interacts with others. Relying on them is like judging a restaurant's success by the number of people who walk past its front door instead of counting who actually sits down, orders a meal, and becomes a regular.
The core issue with vanity metrics is that they measure presence, not engagement. A healthy community isn't just a large audience; it's an active, interconnected group of people creating value for one another and for the brand.
To put it simply, vanity metrics can make you feel good, but actionable metrics help you do good work. Here’s a quick breakdown of the difference.
This table highlights the crucial pivot every community manager needs to make: away from metrics that stroke the ego and toward data that drives strategy.
The conversation around community has rightly moved on from vanity metrics to more meaningful analytics that reflect genuine interaction. This means zeroing in on metrics that prove people are truly involved. For example, the number of active members is a far more powerful indicator than total sign-ups because it tells you who is actually showing up. You can explore more about tying these kinds of strategic community metrics to business impact to see this in action.
This shift helps you draw a straight line from community health to business goals. Instead of just reporting on follower growth, modern community managers are now equipped to answer the questions that matter:
When you start asking—and answering—these questions, you build a measurement framework that proves your community’s strategic value. It’s no longer about having a big community; it’s about having an effective one. This is how you transform your community from a perceived cost center into a powerful, undeniable business asset.
If you really want to get a handle on your community's health, you can't just look at a random list of data points. You need a solid framework. This helps you organize your community engagement metrics into categories that actually mean something, turning a bunch of numbers into a clear story about how your community is doing. Instead of getting lost in the data, let's break it down into three core pillars.
This approach organizes the essential metrics into three distinct areas:
When you separate metrics like this, you can pinpoint specific strengths and weaknesses. For example, high participation with low interaction is a classic sign of a community where people are consuming content but not connecting with each other. That’s a crucial insight for any community manager to act on.
Participation metrics are your first, most fundamental layer of community health. They tell you a simple story: are people showing up and taking basic actions? Think of it like checking the vital signs—is the heart of your community even beating?
While these numbers give you a great starting point, they don't tell the whole story. A high volume of posts that get zero replies can be a big red flag, which leads us right into the next pillar.
Interaction metrics dig a lot deeper. They help you analyze the quality of the engagement. Are members just talking at the community, or are they actually talking with each other? This is where the real fabric of a community is woven.
A self-sustaining community is built on member-to-member replies. This is more than just a number; it's a powerful indicator of a healthy ecosystem that reduces support costs, builds deep loyalty, and creates lasting value.
This infographic breaks down how you can think about the different tiers of metrics, moving from simple counts to more sophisticated ratios.
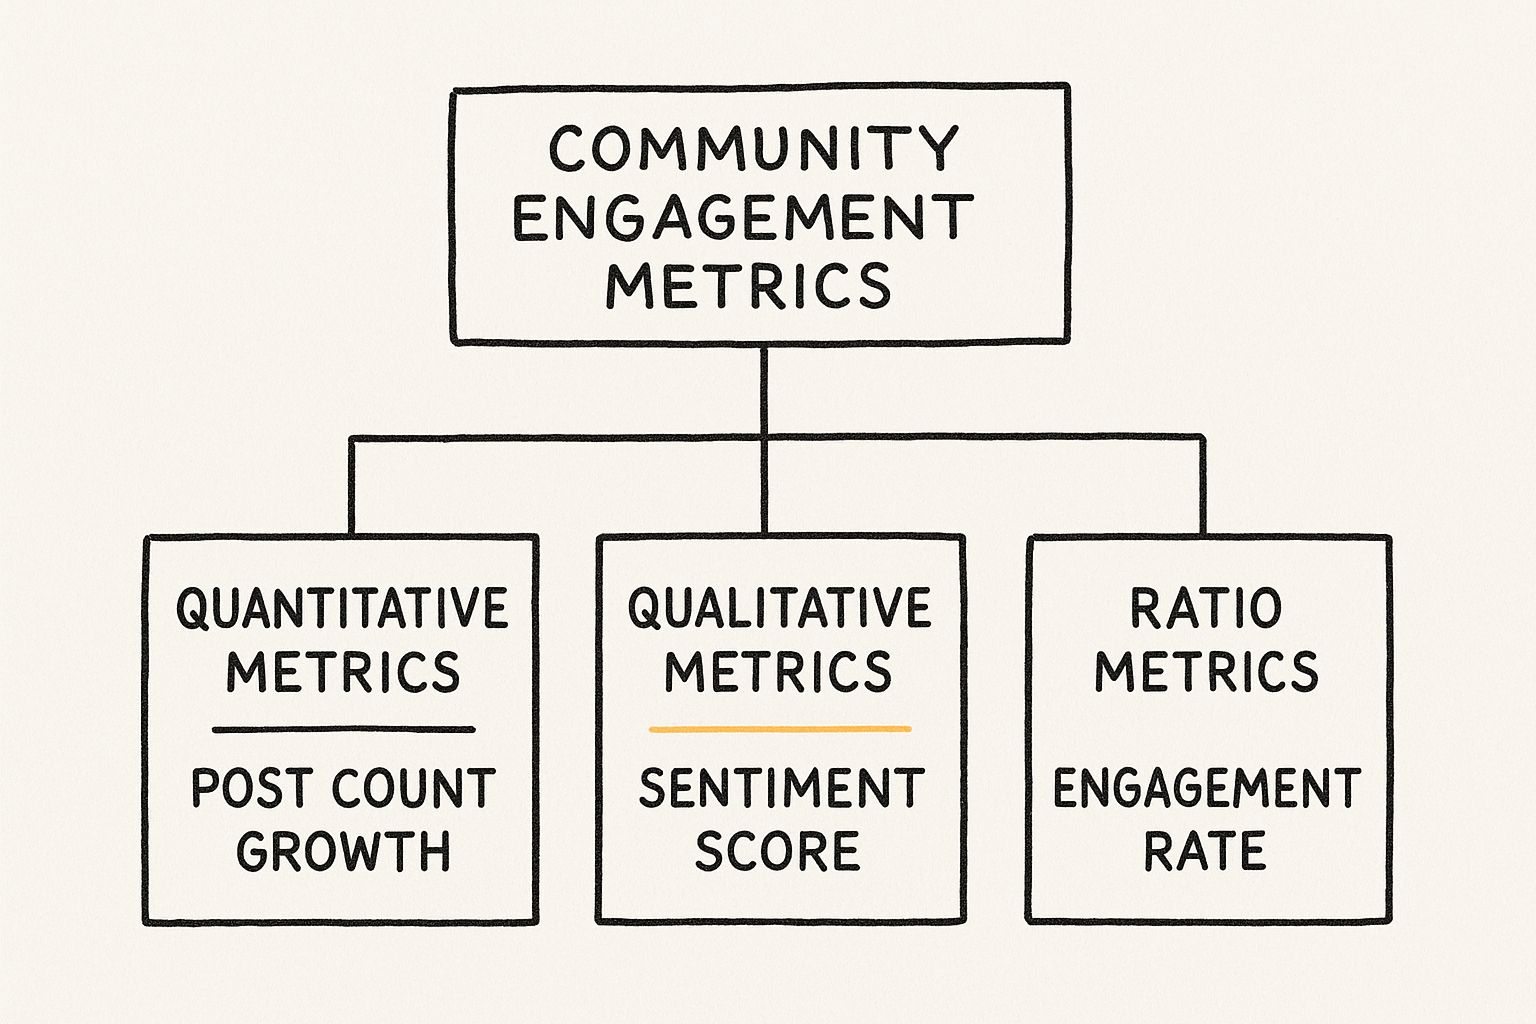
As the visual shows, you start with basic quantitative data (like post counts) and then build up to qualitative insights and powerful ratios (like engagement rates) that give you a much more complete picture.
Here are the key interaction metrics you should be focused on:
At the end of the day, a community needs to create tangible value for both its members and the business. Value creation metrics help you measure that output. They answer the big question: "What is our community actually producing?"
For instance, a customer support community's main value is in resolving issues. An advocacy community's value is found in how well it promotes the brand.
Consider tracking metrics like these:
By building your measurement strategy around these three pillars—Participation, Interaction, and Value Creation—you'll move far beyond surface-level numbers. You’ll start to build a comprehensive, data-backed story of your community's health, its impact, and its truly irreplaceable value.

Collecting data is one thing. Actually knowing what it means and what to do with it? That's where the real work of a community builder begins. Your community engagement metrics are just numbers on a screen until you have a solid plan for tracking them and, more importantly, understanding the story they're telling.
The whole point is to move past simply gathering numbers and start finding actionable insights that will genuinely guide your strategy.
This means you need to know where to find the right data and how to connect the dots. You can find useful bits of information everywhere, from the basic analytics inside platforms like Discord and Slack to the much more powerful dashboards in dedicated community tools. Each source gives you a different piece of the puzzle.
Ultimately, though, the most valuable skill is interpretation. It's about reading between the lines of your data, turning raw numbers into clear directives that help you make smarter decisions for your community.
Before you can analyze anything, you have to get your hands on the raw materials. Where you find your data will depend entirely on the platform your community lives on and the tools you use, but they usually fall into a few main categories.
Native Platform Analytics: Most community platforms (like Facebook Groups, forums, or Discord) have some form of built-in analytics. These are great for a quick look at foundational metrics like active members, post counts, and basic interactions. Think of it as a quick, accessible pulse check.
Third-Party Analytics Tools: Tools like Google Analytics can show you how your community is sending traffic to your website or blog. This is how you start connecting the dots between community activity and bigger business goals, like leads or content downloads.
Specialized Community Platforms: This is the game-changer. An all-in-one platform like GroupOS pulls all your data into one unified dashboard. Here, you can track more subtle metrics, see trends over time, and segment your data without having to stitch everything together from different spreadsheets.
The real magic happens when you start combining data sources. For instance, when you overlay your community's active member data with your website's referral traffic, you can literally see how a healthy, engaged community impacts business objectives.
Your end goal should be to create a single source of truth for your community's health. While it's fine to start with the free, native analytics, a dedicated platform gives you the depth you need to move from just managing a community to strategically leading it.
This kind of clear visualization, like the one from GroupOS above, instantly shows you which areas are thriving and which might need a little help, allowing you to make fast, data-backed decisions.
Once the data is in your hands, the real challenge begins: turning it into something meaningful. A number by itself is just a data point; it’s the context and the trend that give it power. A sudden jump in new posts isn't necessarily a win if they're all met with silence—that's a red flag for low-quality interaction.
Here’s a practical way to think about interpreting your metrics:
Establish a Baseline: Before you can spot a trend, you have to know what "normal" even looks like for your community. Track your core metrics for at least a month to get a feel for your typical rhythm of activity, participation, and interaction.
Look for Trends, Not Just Spikes: A single day of crazy activity might just be a fluke. Real insight comes from watching the patterns over weeks and months. Is your active member rate consistently climbing, or was last week's bump just a temporary boost from a giveaway?
Cross-Reference Your Metrics: This is crucial. Never look at a single metric in a vacuum. If you see event RSVPs dropping, check it against discussion sentiment. Are people bored with the topics? This paints a much fuller picture than just looking at attendance numbers alone.
Connect Data to Community Initiatives: Did you launch a new weekly discussion prompt? Track the average replies per thread before and after to see if it actually worked. Tying data directly to your actions is how you prove what’s worth your time and what isn't.
When you follow this approach, you stop being a data reporter and become a data storyteller. Instead of just saying, "We had 500 new posts," you can confidently state, "Our new member-led Q&A series drove a 40% increase in member-to-member replies, which proves it's improving our peer support value." Now that is how you demonstrate the strategic impact of your community.
Sooner or later, every community manager gets asked the big question from leadership: "What's the return on investment?" Answering this means doing more than just showing off flashy engagement numbers. You have to draw a straight, undeniable line from what’s happening in your community to tangible business results.
Think of it as being a translator. You take the language of your community and convert it into the language of the C-suite. "High member-to-member interaction" becomes "a significant drop in our support ticket volume." "A flood of user-generated content" turns into "slashing our content creation budget." When you frame your successes this way, you’re not just sharing stats; you’re building a rock-solid business case for your community's value.
First things first, you need to pinpoint where your community's engagement directly impacts key business performance indicators (KPIs). For most companies, the clearest connections are found in customer support, retention, and acquisition. The goal is to create a simple framework that turns community actions into dollars and cents.
Let's take a customer support community, for example. One of the most powerful metrics you can track is Accepted User Solutions. This is simply the number of times a member's answer solves another member's problem. Every single one of those accepted solutions is a support ticket your team didn't have to touch.
Example in Action:Let's say your average cost to resolve one support ticket is $25. If your community delivers 100 accepted user solutions in a month, the math is simple and powerful:100 solutions x $25/ticket = $2,500 in monthly operational savings.That's not a vanity metric. That's a clear, quantifiable ROI that leadership can understand instantly.
You can apply this same logic to other parts of the business, too. It’s entirely possible to link active participation to a higher customer lifetime value (LTV) or track community referrals to prove you're lowering the customer acquisition cost (CAC).
The community management market is expected to balloon to $4.5 billion for a reason—brands see this direct link to success. In fact, companies with thriving online communities have reported a 53% higher customer retention rate. It’s proof that sustained engagement builds loyalty that pays off. You can dive deeper into these community management trends and statistics on CreatorLabz.
To make this real for your own work, you need a clear map connecting your community metrics to the business KPIs your company obsesses over. The table below is a great starting point for drawing those connections.
This isn't about tracking every metric under the sun. It’s about being strategic and focusing on the few that tell the most compelling financial story for your organization.
Once you have this data, you're ready to tell a powerful story about your community's impact. Instead of just reporting on activity, you can build a narrative grounded in real business results. The best way to start is by figuring out the top one or two KPIs that matter most to your leadership—is it all about cutting costs, or is boosting revenue the main priority?
From there, you can work backward to pick the community metrics that best illustrate your contribution. This approach makes sure your reports are always relevant and impossible to ignore. It’s a crucial part of developing effective community engagement strategies that actually get the buy-in and budget you need.
Ultimately, proving ROI is about showing everyone that your community isn't just a "nice-to-have." It's an essential engine for growth, loyalty, and efficiency. When you connect the dots between engagement and the bottom line, you secure the resources and recognition your community truly deserves.

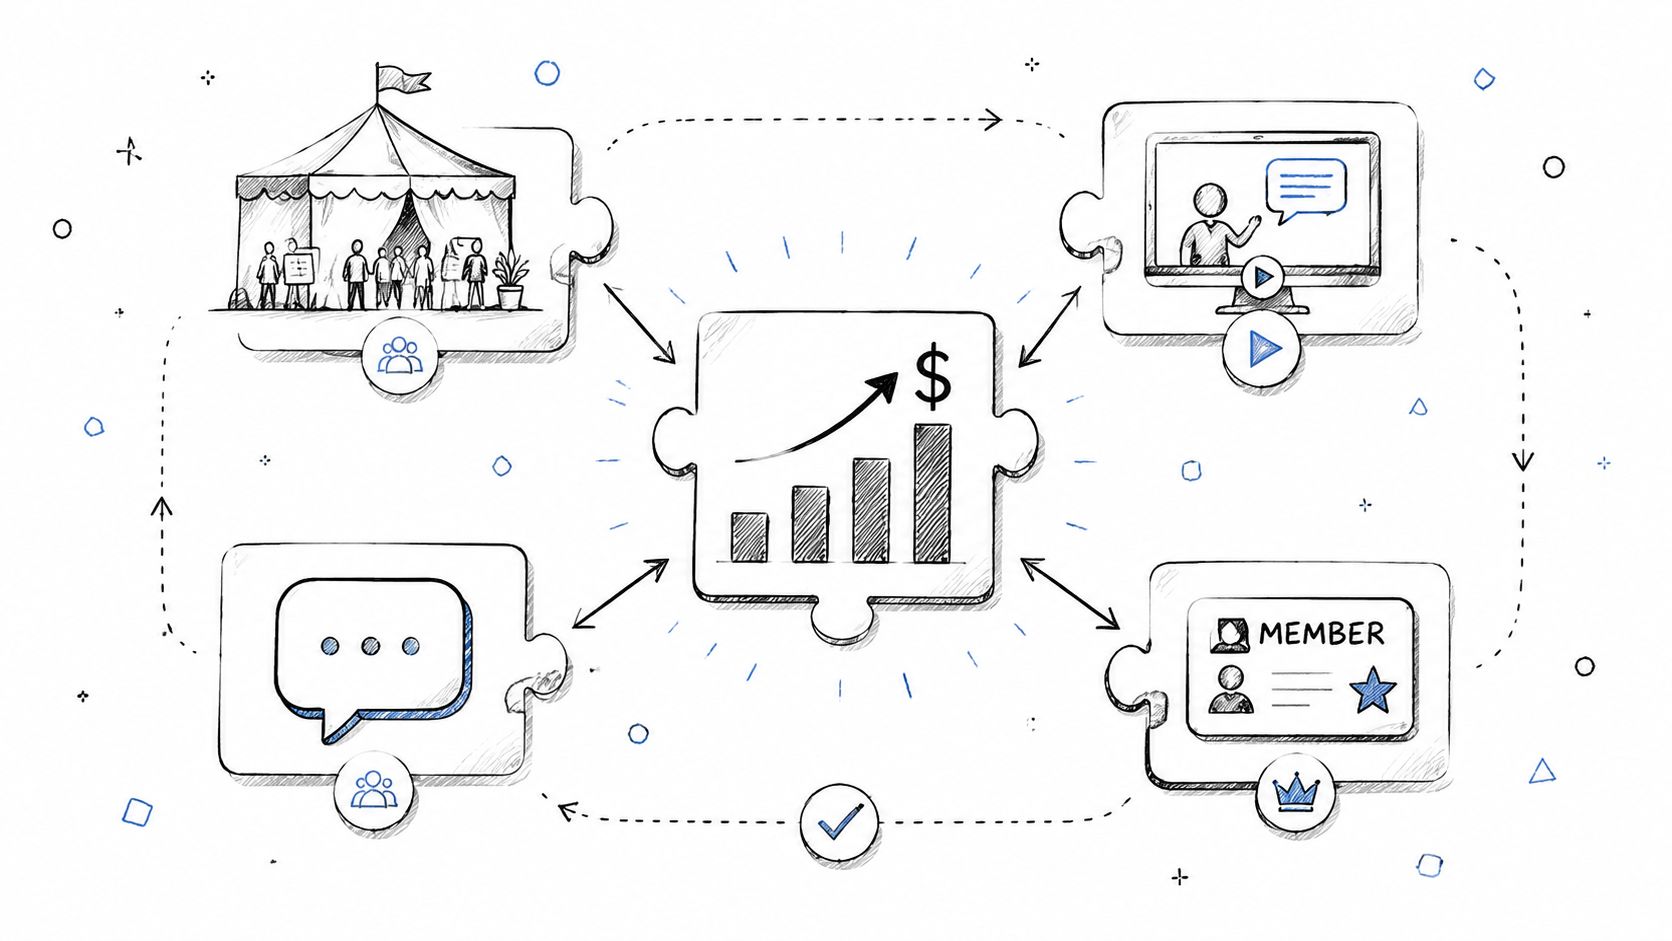
Trying to measure every community with the same yardstick is a classic mistake. It's like using a stopwatch to measure distance—sure, you're tracking something, but it’s not telling you what you actually need to know. The entire purpose of your community dictates what success looks like, which means your community engagement metrics must be chosen to fit those unique goals.
A one-size-fits-all approach to data will only lead you down a path of flawed strategy and misleading insights.
Every community model has a different "why." A customer support hub is all about solving problems fast. A brand advocacy group exists to shout your message from the rooftops. A community of practice is built to help members deepen their expertise. Since each has a different reason for being, each needs a different set of measurements to prove its value.
Let's break down how to zero in on the right metrics for your specific community so you can be sure your data is telling the right story.
When it comes to a customer support community, the name of the game is efficiency. The entire reason it exists is to help users find answers quickly, deflecting tickets that would otherwise flood your support team. Here, speed and accuracy are everything.
You should be obsessed with metrics that put a number on that value:
In this context, things like social shares or general chatter are background noise. The focus is purely on operational excellence and tangible savings.
Now, if your community's goal is to create brand champions, your focus flips from internal efficiency to external influence. These communities are essentially your volunteer marketing department, so your metrics need to reflect their impact on how people see your brand.
The core function of an advocacy community is to turn happy customers into a megaphone for your brand. Your metrics must measure the volume and reach of that megaphone.
Key metrics to watch for this type of community include:
These metrics prove your community’s power to expand your marketing footprint without spending another dime on ads.
In a community of practice, people come together to share what they know, hone their skills, and work through professional roadblocks. Success here has nothing to do with speed or marketing buzz; it’s all about the quality of the knowledge being shared and the professional growth it sparks.
Your metrics should reflect the value of that shared expertise:
This tailored approach is a foundational part of all successful community-building strategies. By aligning your KPIs with your community's core purpose, you stop chasing generic data points and start gathering powerful insights that actually drive your strategy forward.
As you start putting community engagement metrics into practice, you’ll probably run into some common questions. It's one thing to understand the theory, but another to apply it. Let's tackle a few of the most frequent hurdles to help you move forward with confidence.
The best reporting schedule really comes down to who you're talking to. Your leadership team doesn't need the same nitty-gritty details as your community managers. A good rule of thumb is to match the report to the audience.
For your internal community team: A weekly or bi-weekly check-in is usually perfect. This keeps everyone on top of tactical metrics like active members, post volume, and engagement rates. It allows you to see what’s happening in real-time and make quick adjustments.
For leadership and key stakeholders: Think bigger picture. A monthly or quarterly report works much better here. This summary should clearly connect community activity to bottom-line business goals, like improvements in customer retention or a reduction in support costs.
The key is to create a rhythm that helps you take action, not just collect data.
You don't need a huge budget to start understanding your community's health. There are plenty of fantastic free tools that can give you a solid starting point for tracking what matters.
A great place to begin is with the analytics already built into your platform, whether that’s Facebook Groups, Discord, or Slack. These dashboards will give you the basics on active users and post interactions. You can also use Google Analytics to see how your community sends traffic to your website. And honestly, never underestimate the power of a simple spreadsheet in Google Sheets for tracking trends over time.
While these free options are a lifesaver when you're starting out, a dedicated platform will give you much deeper, automated insights as your community scales.
This is the million-dollar question, but there’s no single magic number. What's "good" can vary wildly depending on your community’s age, purpose, and platform. That said, most community pros would agree that a monthly active user (MAU) rate between 15-30% of your total membership is a pretty healthy sign for an established community.
Instead of chasing a universal benchmark, pay closer attention to your own trend line. Is your active member rate consistently growing month over month? That’s the real indicator of a healthy, valuable community. Your own progress is a much better story than how you stack up against someone else.
Gauging sentiment is all about understanding the collective mood or emotional tone of your community. You can get a read on this both qualitatively and quantitatively.
On the qualitative side, there's no substitute for simply reading the room. Make it a regular habit to scroll through discussions and comments. This manual check-in gives you a feel for the general vibe and helps you spot recurring themes that automated tools might miss.
For a more quantitative approach, you can use platform features to tag posts with labels like 'praise' or 'complaint'. As you grow, social listening tools can automate this by analyzing language and classifying posts as positive, negative, or neutral. It's often best to start manually to build intuition, then bring in tools to help you scale.
Ready to stop wrestling with spreadsheets and start getting clear, actionable insights? GroupOS pulls all your community engagement metrics into one clean, intuitive dashboard. See what’s working, prove your ROI, and make data-driven decisions that fuel real growth. Start your free trial today.